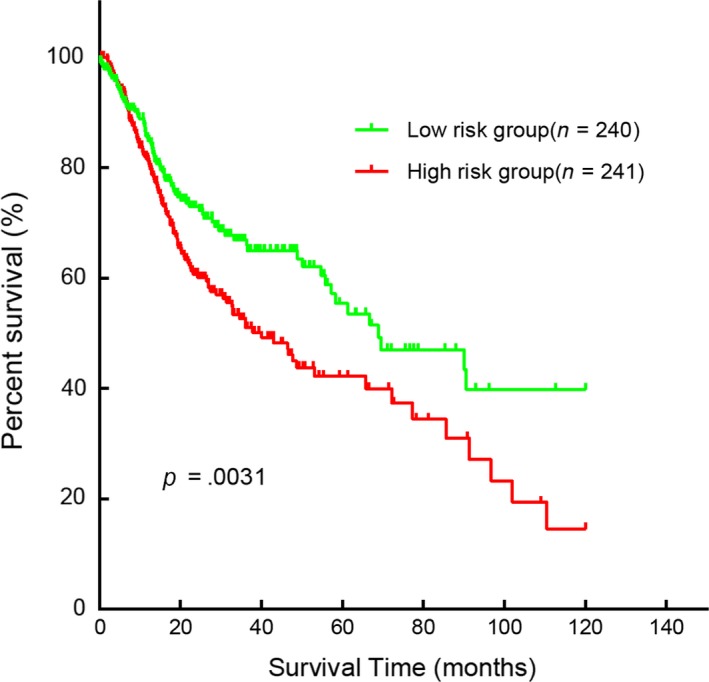
Figure 5.

Kaplan‐Meier curve for the two‐miRNA signature in HNSCC. The patients were categorized into high‐risk group and low‐risk group based on median Risk‐Score. Compared to the low‐risk group, patients in the high‐risk group had a poorer prognosis (P = .0031)
