
Figure 6.
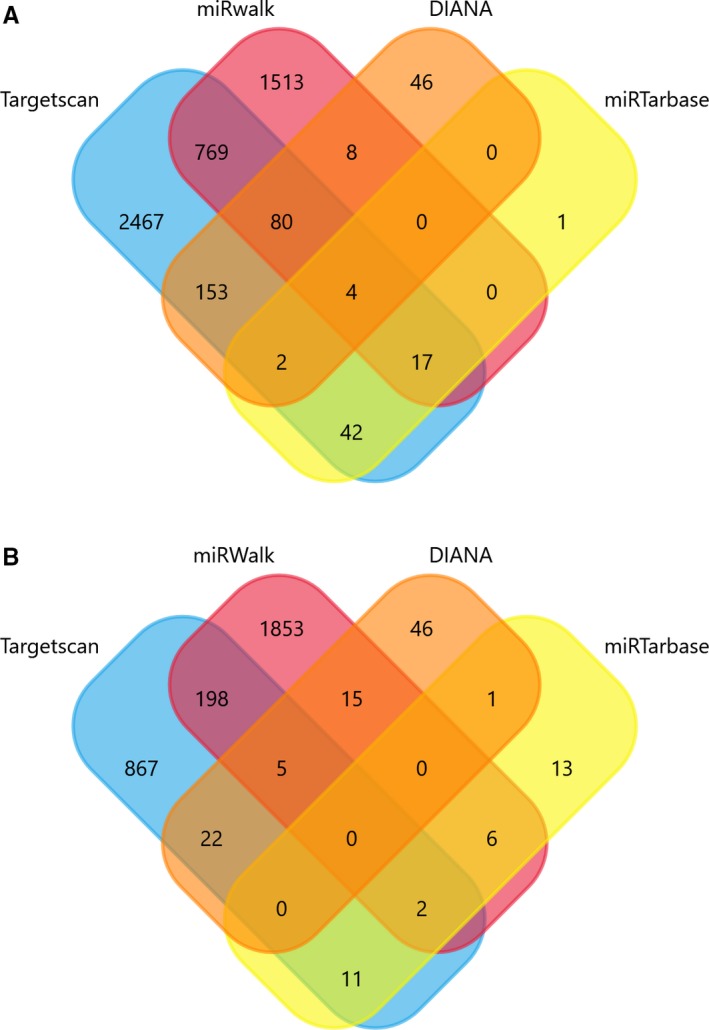
Venn diagram depicting the number of predicted target genes from miRanda, miRDB, TargetScan, and DIANA‐microT‐CDS. The overlaps indicated the numbers of genes predicted by more than one algorithm. (A: miR‐4652‐5p; B: miR‐99a‐3P)
Official websites use .gov
A
.gov website belongs to an official
government organization in the United States.
Secure .gov websites use HTTPS
A lock (
) or https:// means you've safely
connected to the .gov website. Share sensitive
information only on official, secure websites.
Venn diagram depicting the number of predicted target genes from miRanda, miRDB, TargetScan, and DIANA‐microT‐CDS. The overlaps indicated the numbers of genes predicted by more than one algorithm. (A: miR‐4652‐5p; B: miR‐99a‐3P)