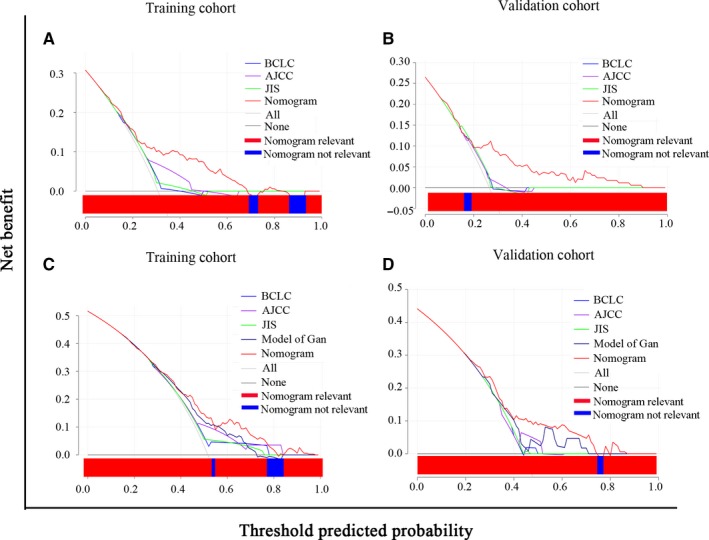
Figure 5.

Decision curve analysis (DCA) for overall survival (OS) and recurrence free survival (RFS) of prognostic models. A‐B. DCA for OS in training (A) and validation (B) cohorts. C‐D, DCA for RFS in training (C) and validation (D) cohorts. The x‐axis and the y‐axis represent threshold probability and net benefit, respectively. The black line corresponds to no patients experiencing the indicated event, and the gray line corresponds to the death of all patients
