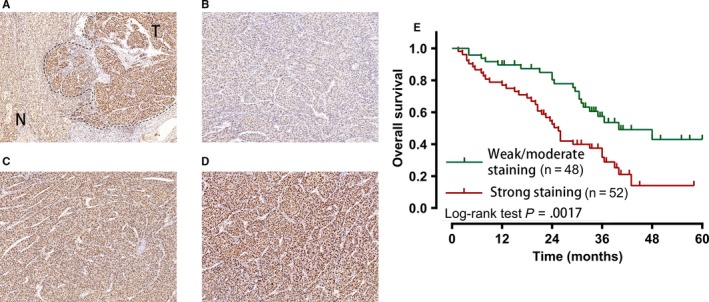
Figure 2.

Kaplan‐Meier OS curves for immunohistochemistry of METTL3 in 100 HCC patients. A, Immunohistochemistry staining of METTL3 in HCC tumor tissues and the adjacent normal tissues. (B‐D) Representative images of METTL3 expression in HCC tissues. B, Tissue with weak METTL3 staining. C, Tissue with moderate METTL3 staining. D, Tissue with strong METTL3 staining. E, Comparison of overall survival in patients with HCC with strong METTL3 staining and weak or moderate METTL3 staining. T, tumor tissues; N, normal tissues
