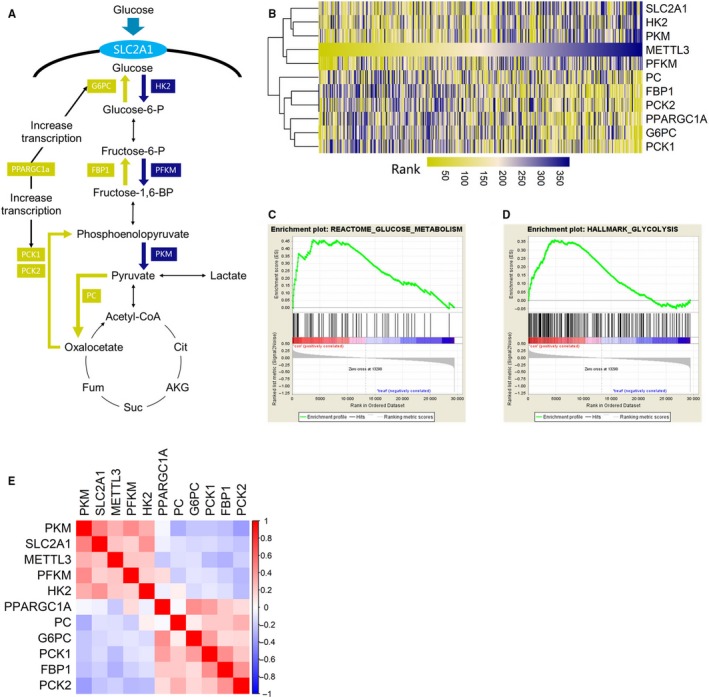
Figure 3.

METTL3 expression was associated with altered glucose metabolism in HCC cases. A, Illustration of enzymes involved the key steps in glucose metabolic flux. B, Heatmap with cluster analysis of METT3 expression and glucose metabolism related genes revealed a co‐expression trend between METTL3 and genes involved in glycolysis. C, D, GSEA plot of two predefined gene sets based on the METTL3 expression revealed genes involved in normal glucose metabolism were significantly enriched in HCC cases with lower METTL3 expression, which suggesting that normal glucose metabolism was preserved in these cases. E, A heatmap displaying the Spearman rank correlation test results which implied positive correlation between METTL3 expression and glycolysis‐related genes and negative correlation between METTL3 expression and glycogenesis‐related genes, the bar indicates the value of spearman correlation coefficient
