Figure 5.

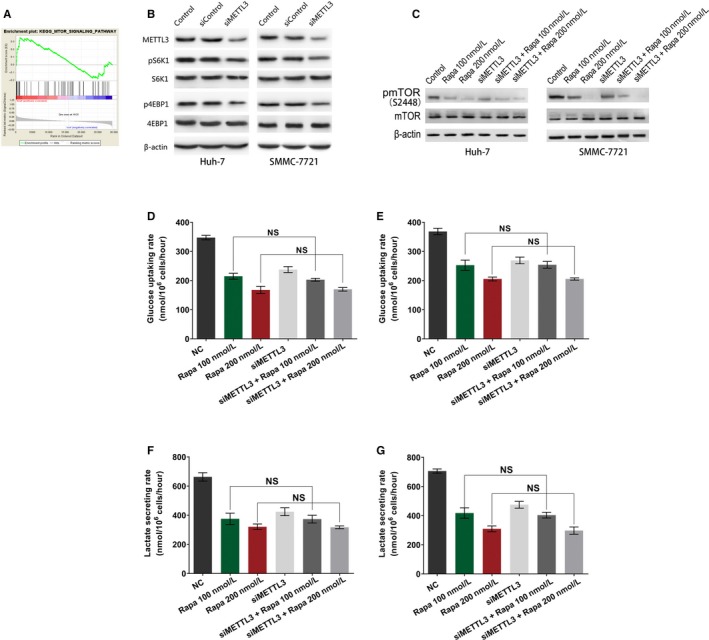
Correlation between METTL3 expression and activity of mTORC1 activity. A, GSEA plot of mTOR signal pathway based on METTL3 expression levels in TCGA cases. B, HCC cell lines were treated with siRNA oligonucleotides or not, then the indicated proteins were detected by WB. (C‐G) The HCC cell lines were treated with rapamycin or co‐treated with siRNA oligonucleotides, for 48 h followed by immunoblotting for mTOR phosphorylation levels (C), glucose uptake assays in HCC cells Huh‐7 (D) and SMMC‐7721 (E), and lactate production assays in Huh‐7 cell line (F) and SMMC‐7721 cell line (G). H, I, Gene‐specific m6A‐IP‐qPCR results showing the relative methylation levels of five RNAs in the HCC cell lines treated with siRNA oligonucleotides compared to those normal control cells
