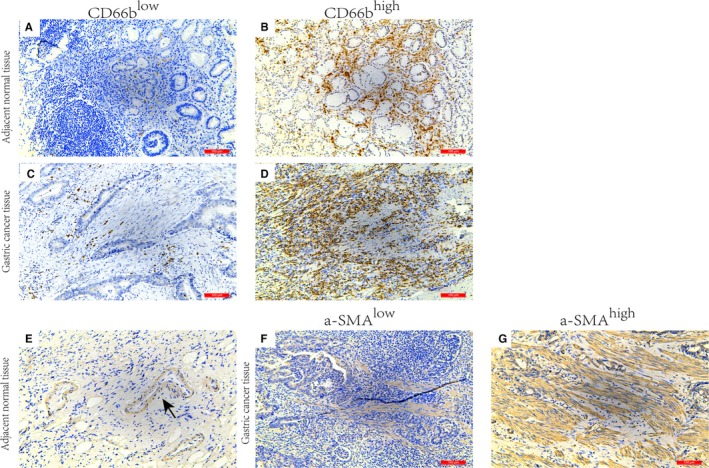
Figure 1.

Immunohistochemical images of α‐SMA and CD66b expression in gastric adenocarcinoma tissue samples. Representative examples of low‐ and high‐density CD66b expression (A‐D) in gastric cancer tissue samples and adjacent normal tissue samples. Representative examples of low‐ and high‐density α‐SMA expression (E‐G) in gastric cancer tissue samples and adjacent normal tissue samples (arrow indicates positive α‐SMA staining of vascular smooth muscle cells). α‐SMA, α‐smooth muscle actin
