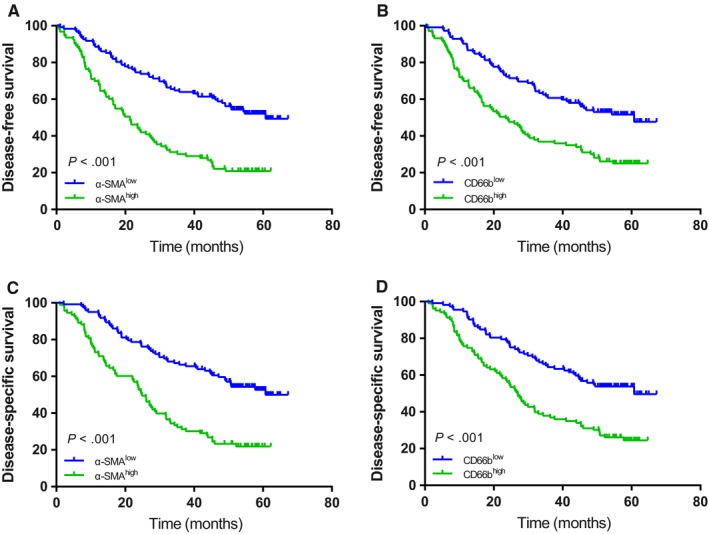
Figure 3.

Kaplan‐Meier survival curves of patients with gastric cancer stratified according to α‐SMA and CD66b expression. DFS (A and B) and DSS (C and D) of patients with low and/or high densities of α‐SMA and CD66b in gastric cancer. α‐SMA, α‐smooth muscle actin; DFS, disease‐free survival; DSS, disease‐specific survival
