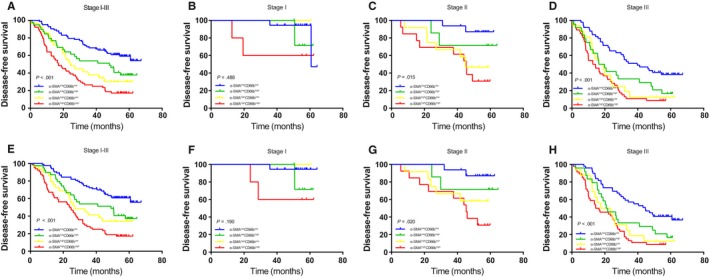
Figure 6.

Kaplan‐Meier survival curves based on α‐SMA and CD66b coexpression in gastric cancer patients (pTNM stage I‐III). DFS (A‐D) among subgroups stratified by the combination of α‐SMA and CD66b expression. DSS (E‐H) among subgroups stratified by the combination of α‐SMA and CD66b expression. α‐SMA, α‐smooth muscle actin; DFS, disease‐free survival; DSS, disease‐specific survival
