
Figure 6.
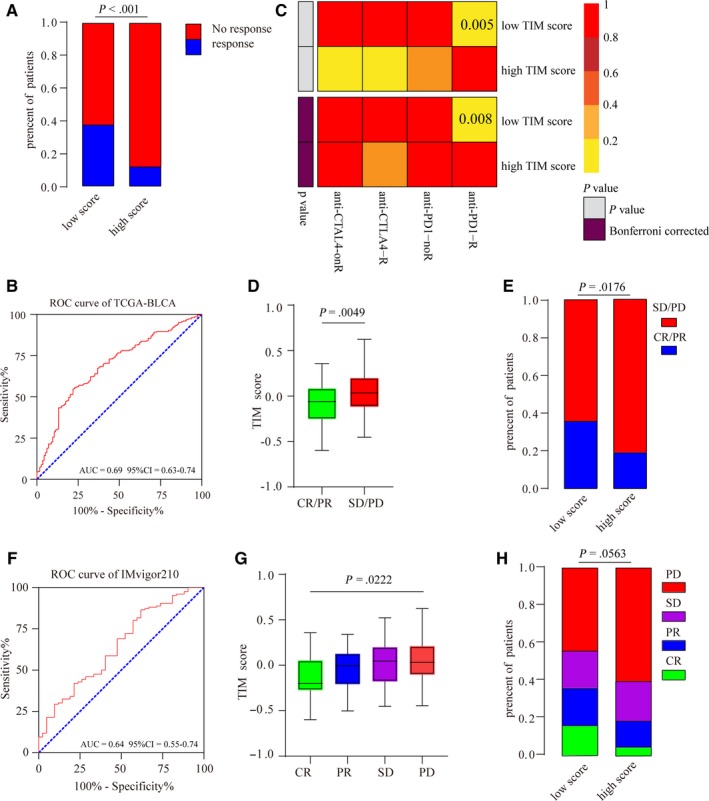
The TIM signature could predict the immunotherapeutic response of MIBC patients. (A) Rates of the different anti‐PD1 and anti‐CTLA4 responses of patients from the TCGA‐BLCA cohort predicted by the Tumor Immune Dysfunction and Exclusion (TIDE) web program in the high or low TIM score groups (Chi‐square test, P < .001). (B) Receiver operating characteristic (ROC) curves evaluating accuracy of the TIM signature for predicting the anti‐PD1 and anti‐CTLA4 response of patients from the TCGA‐BLCA cohort (AUC (area under the ROC curve)=0.69, 95% CI (confidence interval)=0.63‐0.74). (C) Submap analysis revealed that patients with low TIM scores are more responsive to anti‐PD1 treatment (Fisher's exact test, P = .005, Bonferroni‐corrected P = .008). (D) The TIM scores of patients from the IMvigor210 cohort with different anti‐PD‐L1 response statuses (stable disease (SD)/progressive disease (PD), complete response (CR)/partial response (PR)). The bottom and top of the boxes represent the upper quartile and lower quartile percentiles, respectively. The whiskers encompass the maximum and minimum expression levels (Mann‐Whitney U test, P = .0049). (E) The rates of different anti‐PD‐L1 responses of patients from the IMvigor210 cohort in the high or low TIM score groups (SD/PD, CR/PR) (chi‐square test, P = .0176). (F) ROC curves evaluating the accuracy of the TIM signature for predicting the anti‐PD‐L1 response of patients from the IMvigor210 cohort (AUC = 0.64, 95% CI = 0.55‐0.74). (G) The TIM scores of patients from the IMvigor210 cohort with different anti‐PD‐L1 response statuses (SD, PD, CR, and PR). The bottom and top of the boxes represent the upper quartile and lower quartile percentiles, respectively. The whiskers encompass the maximum and minimum expression levels (Kruskal‐Wallis test, P = .0222). (H) The rates of different anti‐PD‐L1 responses of patients from the IMvigor210 cohort in the high or low TIM score groups (SD, PD, CR, and PR) (Chi‐square test, P = .0563)