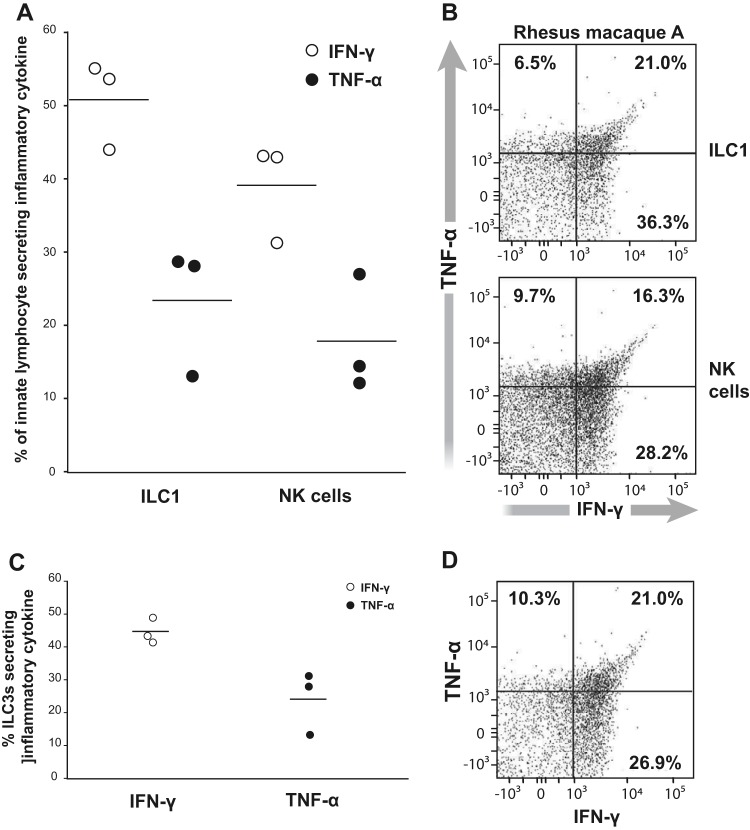
FIG 9.
TNF-α and IFN-γ production by ILC3s, ILC1s, and NKs. (A and C) IFN-γ (open circle) or TNF-α (closed circle) from ILC1s and NKs (A) and ILC3s (C) measured from three different SIV-infected colons. Bars in the dot plot represent the means from three IFN-γ- or TNF-α-producing ILC1s or NKs. (B and D) Example of ILC3s, ILC1s, and NKs expressing TNF-α and IFN-γ. Gates are set based on FMOs for TNF-α and IFN-γ staining.

