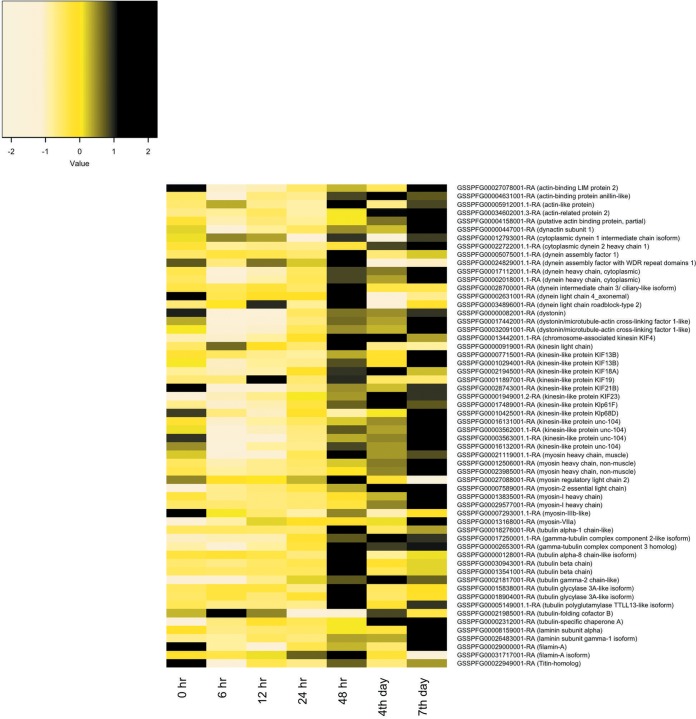
FIG 2.
Heat map representation of cytoskeleton gene expression in Spodoptera frugiperda third-instar larvae infected with Spodoptera frugiperda ascovirus 1a. Expression patterns are for genes changing by 2-fold or more at any time point postinfection. The heat map color scale represents the z-scale of the transcripts per million (TPM) value of replicate expression level averages at each time point. The S. frugiperda gene identifications can be accessed through the SfruDB Information system (http://bipaa.genouest.org/is/lepidodb/spodoptera_frugiperda/) (67).

