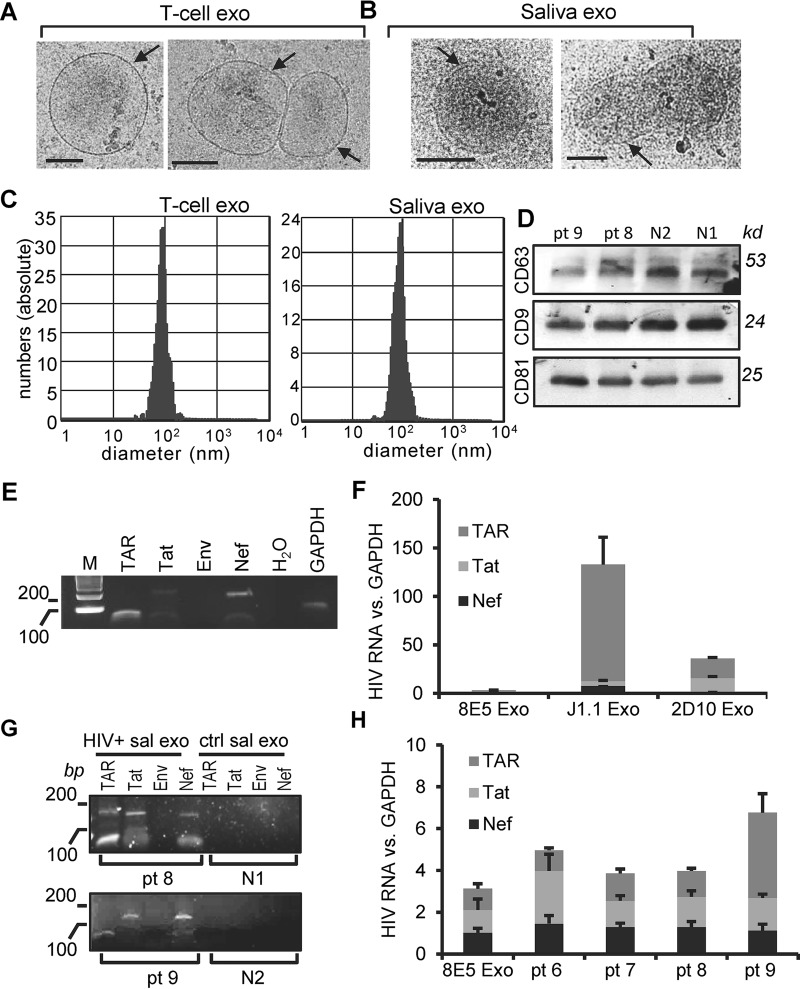
FIG 1.
Characterization of HIV-associated saliva exosomes. (A and B) Cryo-EM images of exosomes (exo) from Jurkat T cells (A) and the saliva of healthy donors (B). Arrows, exosome membrane. Bars, 100 nm. (C) Size distribution of exosomes from the culture supernatants of Jurkat T cells (T-cell exo) and the saliva of healthy donors (Saliva exo) determined with the ZetaView nanoparticle tracking analyzer. (D) Immunoblot images of total proteins extracted from saliva exosomes from HIV+ (pt 8 and pt 9) and healthy (N1 and N2) donors. kd, kilodaltons. (E) RT-PCR gel images of the HIV TAR (60 bp), Tat (192 bp), Env (168 bp), and Nef (175 bp) PCR products in exosomes isolated from the culture supernatants of J1.1 cells. Lane M, molecular size markers (with the numbers to the left indicating molecular sizes [in base pairs]). (F) Quantitative RT-PCR of TAR, Tat, and Nef RNAs on total RNA extracted from exosomes secreted from HIV+ 8E5/LAV (8E5), J1.1, and 2D10 T cells. The levels of HIV RNAs of exosomes from J1.1 and 2D10 cells were compared to those of exosomes from 8E5/LAV cells containing a single copy of the HIV proviral genome. (G) RT-PCR gel images of HIV TAR, Tat, Env, and Nef amplimers in saliva exosomes (sal exo) purified from HIV+ (pt 8 and pt 9) and healthy (N1 and N2) donors. Note a nonspecific, ∼170-bp PCR band in the TAR lane for pt 8. (H) Quantitative RT-PCR of TAR, Tat, and Nef RNAs in exosomes purified from the saliva of HIV+ donors (pt 6 to pt 9). Exosomal RNA from HIV+ 8E5/LAV cells (8E5 Exo) was used as a control. The levels of each HIV RNA over those of GAPDH (glyceraldehyde-3-phosphate dehydrogenase) RNA in exosomes were quantified.

