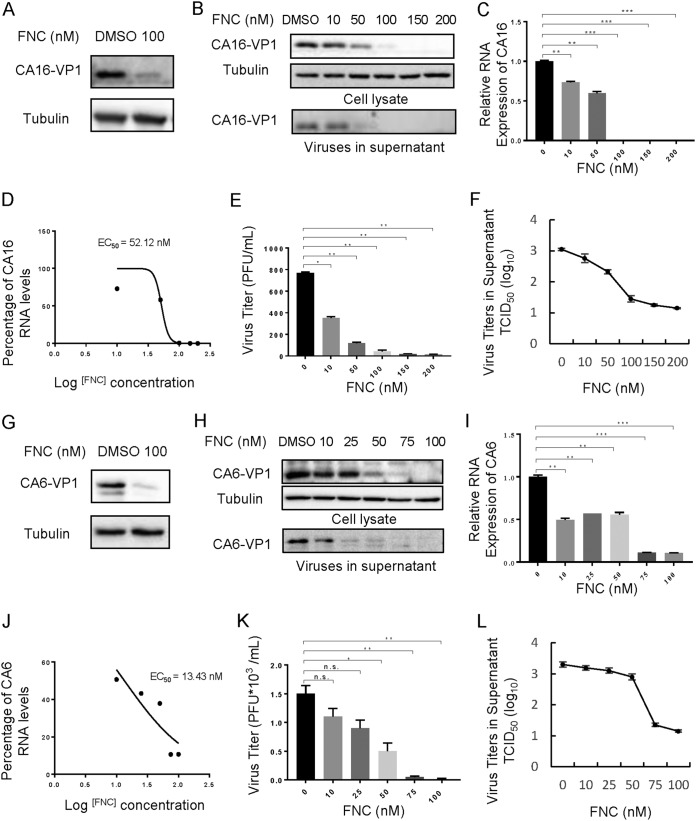
FIG 4.
FNC potently inhibits the replication of CA16 and CA6 in a dose-dependent manner. (A and G) A 100 nM dose of FNC inhibited CA16 (A) and CA6 (G) viral replication in RD cells. (B) The inhibitory effect of FNC on CA16 replication in the 10 to 200 nM dose range. The CA16 VP1 protein in cell lysate or culture supernatant was detected by WB analysis, and tubulin was used as a loading control. (C) CA16 RNA levels in the cells from the experiments shown in panel B were detected by RT-qPCR. GAPDH was used as a control. The CA16 RNA level without FNC treatment was set as 100%. (D) The EC50 of FNC was calculated according to panel C using GraphPad Prism7. (E and F) The viral titers in the supernatants from the experiment shown in panel B were determined by the plaque assay (E) and by the cytopathic effect (CPE) method (F). (H) The inhibitory effect of FNC on CA6 replication in the 10 to 100 nM dose range. The CA6 VP1 protein in cell lysate or culture supernatant was detected by WB analysis, and tubulin was used as a loading control. (I) CA6 RNA levels in the cells from the experiments shown in panel H were detected by RT-qPCR. GAPDH was used as a control. The CA6 RNA level without FNC treatment was set as 100%. (J) The EC50 of FNC was calculated according to panel I using GraphPad Prism7. Viral titers in the supernatants from the experiment shown in panel H were determined by the plaque assay (K) and by the CPE method (L). The results are shown the means with SDs from two independent experiments. The asterisks indicate statistically significant differences between groups, as assessed by Student's t test (*, P ≤ 0.05; **, P ≤ 0.01; and ***, P ≤ 0.001; ns, not significant).

