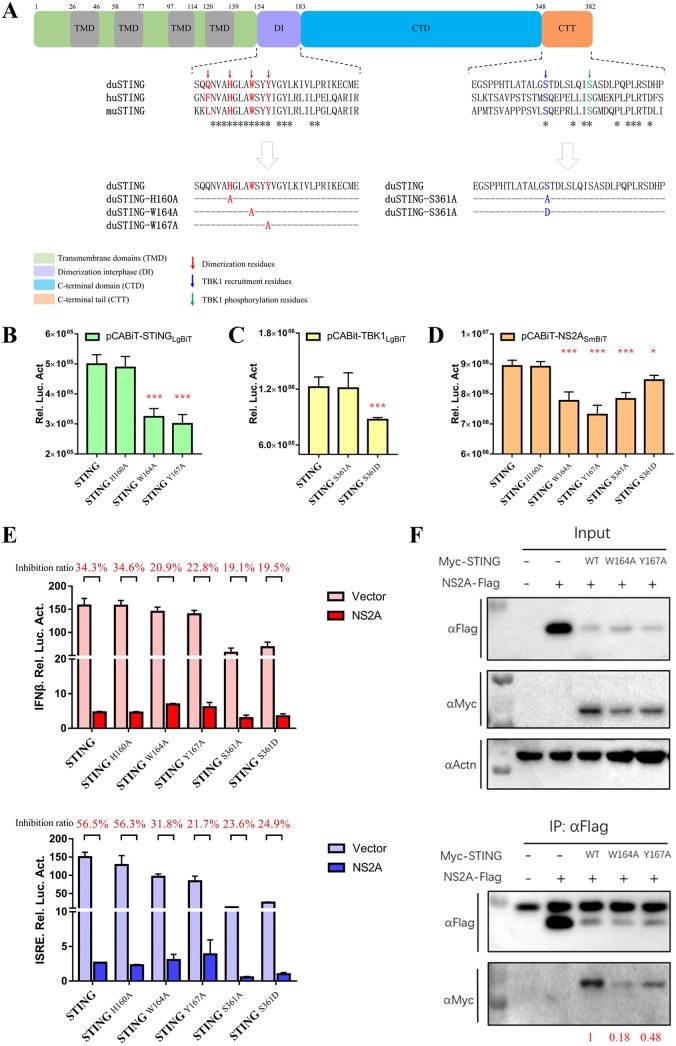
FIG 8.
The dimerization and phosphorylation sites of STING are critical for its interactions with NS2A and subsequent IFN induction. (A) Sequence analysis of duSTING protein functional domains and multiple alignment of duSTING (GenBank accession number XP_027323921.1), huSTING (GenBank accession number NP_938023), and muSTING (GenBank accession number NP_082537). (B) Interaction of STING with STING dimerization-related mutants. DEF cells were cotransfected with pCABiT-STING-LgBiT-Myc (50 ng/well) and pCABiT-STING-SmBiT-Flag mutants (H160A, W164A, and Y167A) (50 ng/well). After 20 h of transfection, the luminescence was detected. (C) Interaction of TBK1 with STING phosphorylation-related mutants. DEF cells were cotransfected with pCABiT-TBK1-LgBiT-Myc (50 ng/well) and pCABiT-STING-SmBiT-Flag mutants (S361A and S361D) (50 ng/well). After 20 h of transfection, the luminescence was detected. (D) Interaction of NS2A with STING dimerization- and phosphorylation-related mutants. DEF cells were cotransfected with pCABiT-NS2A-SmBiT-Flag (50 ng/well) and pCABiT-STING-LgBiT-Myc mutants (H160A, W164A, Y167A, S361A, and S361D) (50 ng/well). After 20 h of transfection, the luminescence was detected. (E) The inhibitory effects of NS2A on STING mutants-mediated IFN-β/ISRE-Luc reporter activities. DEF cells were cotransfected with pCAGGS-NS2A-His (50 ng/well) and pCAGGS-STING-Flag mutants (H160A, W164A, Y167A, S361A, and S361D) (50 ng/well) and subsequently transfected with pRL-TK plasmid (5 ng/well), pGL3-IFN-β-Luc, or pGL4-ISRE-Luc (50 ng/well). At 24 h posttransfection, the IFN-β/ISRE-Luc activity was measured. The inhibition ratio was determined using the following formula: inhibition ratio (%) = (1-IFN-β/ISRE-Luc reporter value of NS2A transfected / IFN-β/ISRE-Luc reporter value of vector transfected) × 100%. (F) Coimmunoprecipitation of NS2A and STING mutants (H160A, W164A, and Y167A). DEF cells were cotransfected with pCAGGS-NS2A-His and pCAGGS-STING-Flag mutants (H160A, W164A, and Y167A). At 24 h posttransfection, cells were lysed in Pierce IP lysis buffer (Thermo Fisher), and whole-cell extracts (WCEs) were loaded as input. WCEs were incubated with 10 μg of the indicated antibody and 1 mg of SureBeads Protein G. Finally, The protein expression levels were determined by Western blot analysis, and the results were quantified by ImageJ software (represented with red). All data are represented as the mean ± SEM (n = 4). Significant differences from the mock groups are indicated by *, P < 0.05; **, P < 0.01; ***, P < 0.001.

