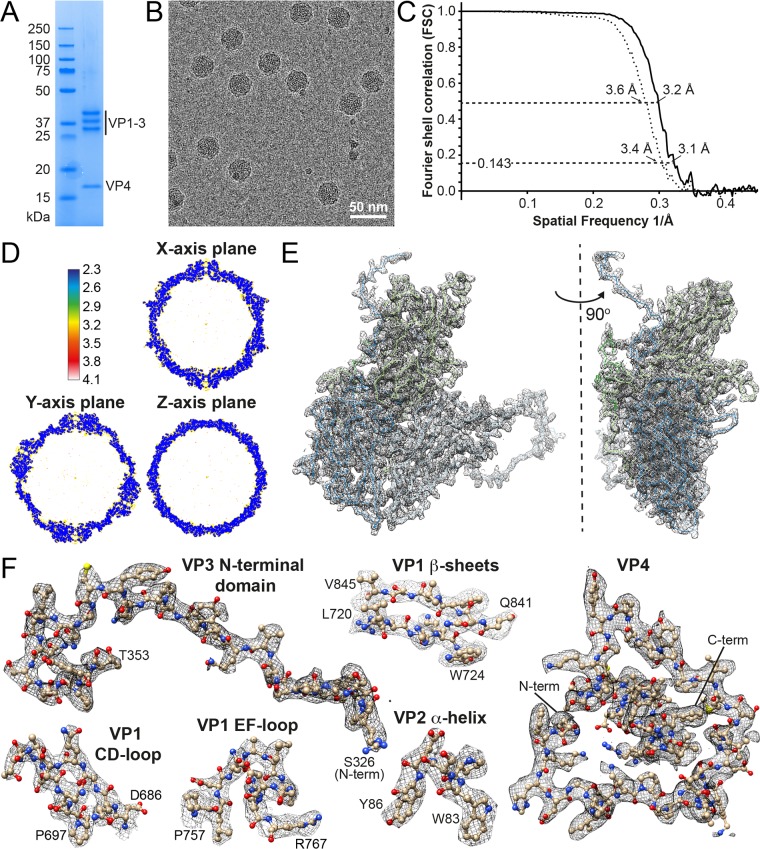
FIG 1.
Characterization and structure determination of CtenRNAV-II. (A) SDS-PAGE for viral protein composition analysis. (B) Cryo-EM raw image of CtenRNAV-II. (C) The gold standard FSC resolution curves of masked (solid line) and unmasked (dotted line) reconstructions of the CtenRNAV-II particle. The resolution at FSC = 0.143 (gold standard threshold [36, 37] is 3.1 Å) and at FSC = 0.5 is 3.2 Å. (D) A local resolution map of the final reconstruction generated by ResMap, showing a resolution distribution from 2.3 to 4.1 Å. (E) Cα backbone trace of a single icosahedral protomer and the corresponding electron density map. The individual proteins are colored according to the following code: VP1, light green; VP2, light blue; VP3, dark blue; VP4, dark green. Left: view from the outside of the capsid showing VP1-3 located on the surface. Right: view when rotated 90° to the right, visualizing VP4 beneath the surface. A video showing the electron density map and fit of the model is provided in Movie S1. (F) Refined side chains of representatives of secondary structural elements and the entire VP4.

