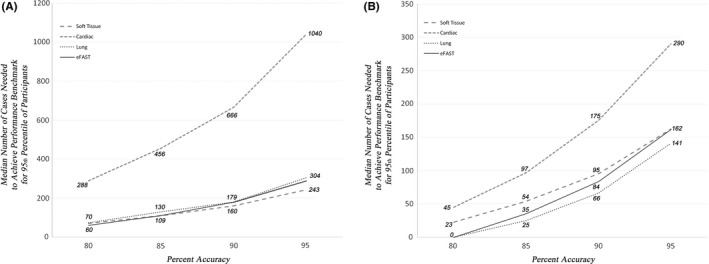
Figure 4.

(A) The x‐axis represents the benchmark level of proficiency as chosen by the educator. The y‐axis represents the predicted number of cases required to achieve that benchmark based on the logistic regression model described in the text. The two panels represent two different educational contexts. (A) The median learner is represented—50% of learners required fewer cases to achieve the benchmark; 50% required more. (B) A higher ambition is presented: the number of cases required of the marginal learner so that 95% of the learners will have achieved the given benchmark (i.e., 95% of learners would need to do fewer; 5% would need to do even more). FAST = focused assessment sonography for trauma.
