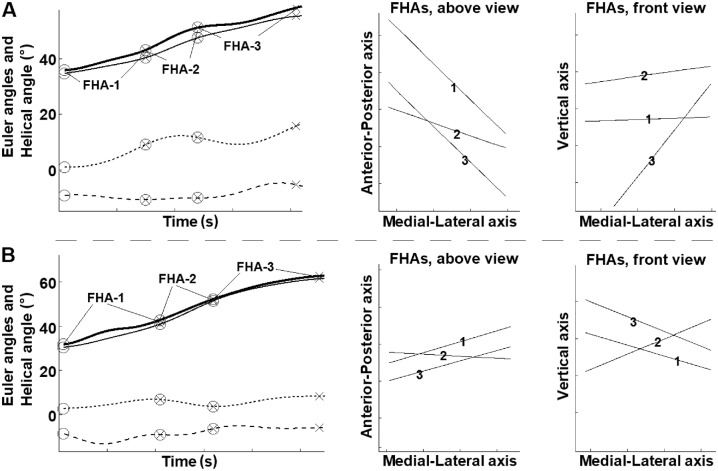
Figure 1.
Example of a hop landing trial from 2 participants who demonstrated (A) high and (B) low finite helical axis (FHA) inclination angles. Displayed on the left are the knee motion curves during the landing (from initial contact to peak knee flexion), where the thick solid line is the helical axis rotation angle, the thin solid line is the flexion/extension angle, the dotted line is the adduction/abduction angle, and the dashed line is the internal/external rotation angle. The rings indicate the start of the knee helical motion for a new FHA, and crosses indicate when 10° of helical rotation has occurred, which generates the discrete FHA inclination angles. Greater motion in the knee frontal and/or transverse planes relative to the sagittal plane generates greater FHA inclination angles, which indicate poorer knee robustness. For visualization, in the middle are the FHAs as shown from above, where greater motion in the frontal relative to the sagittal plane results in FHAs directed more along the anterior-posterior axis. To the right are the FHAs as shown from the front, where greater motion in the transverse relative to the sagittal plane results in FHAs directed more along the vertical axis. The individual in panel A displayed FHA inclination angles of 57.8° for FHA-1, 20.7° for FHA-2, and 43.9° for FHA-3, while the individual in B displayed FHA inclination angles of 22.7° for FHA-1, 22.7° for FHA-2, and 26.0° for FHA-3.

