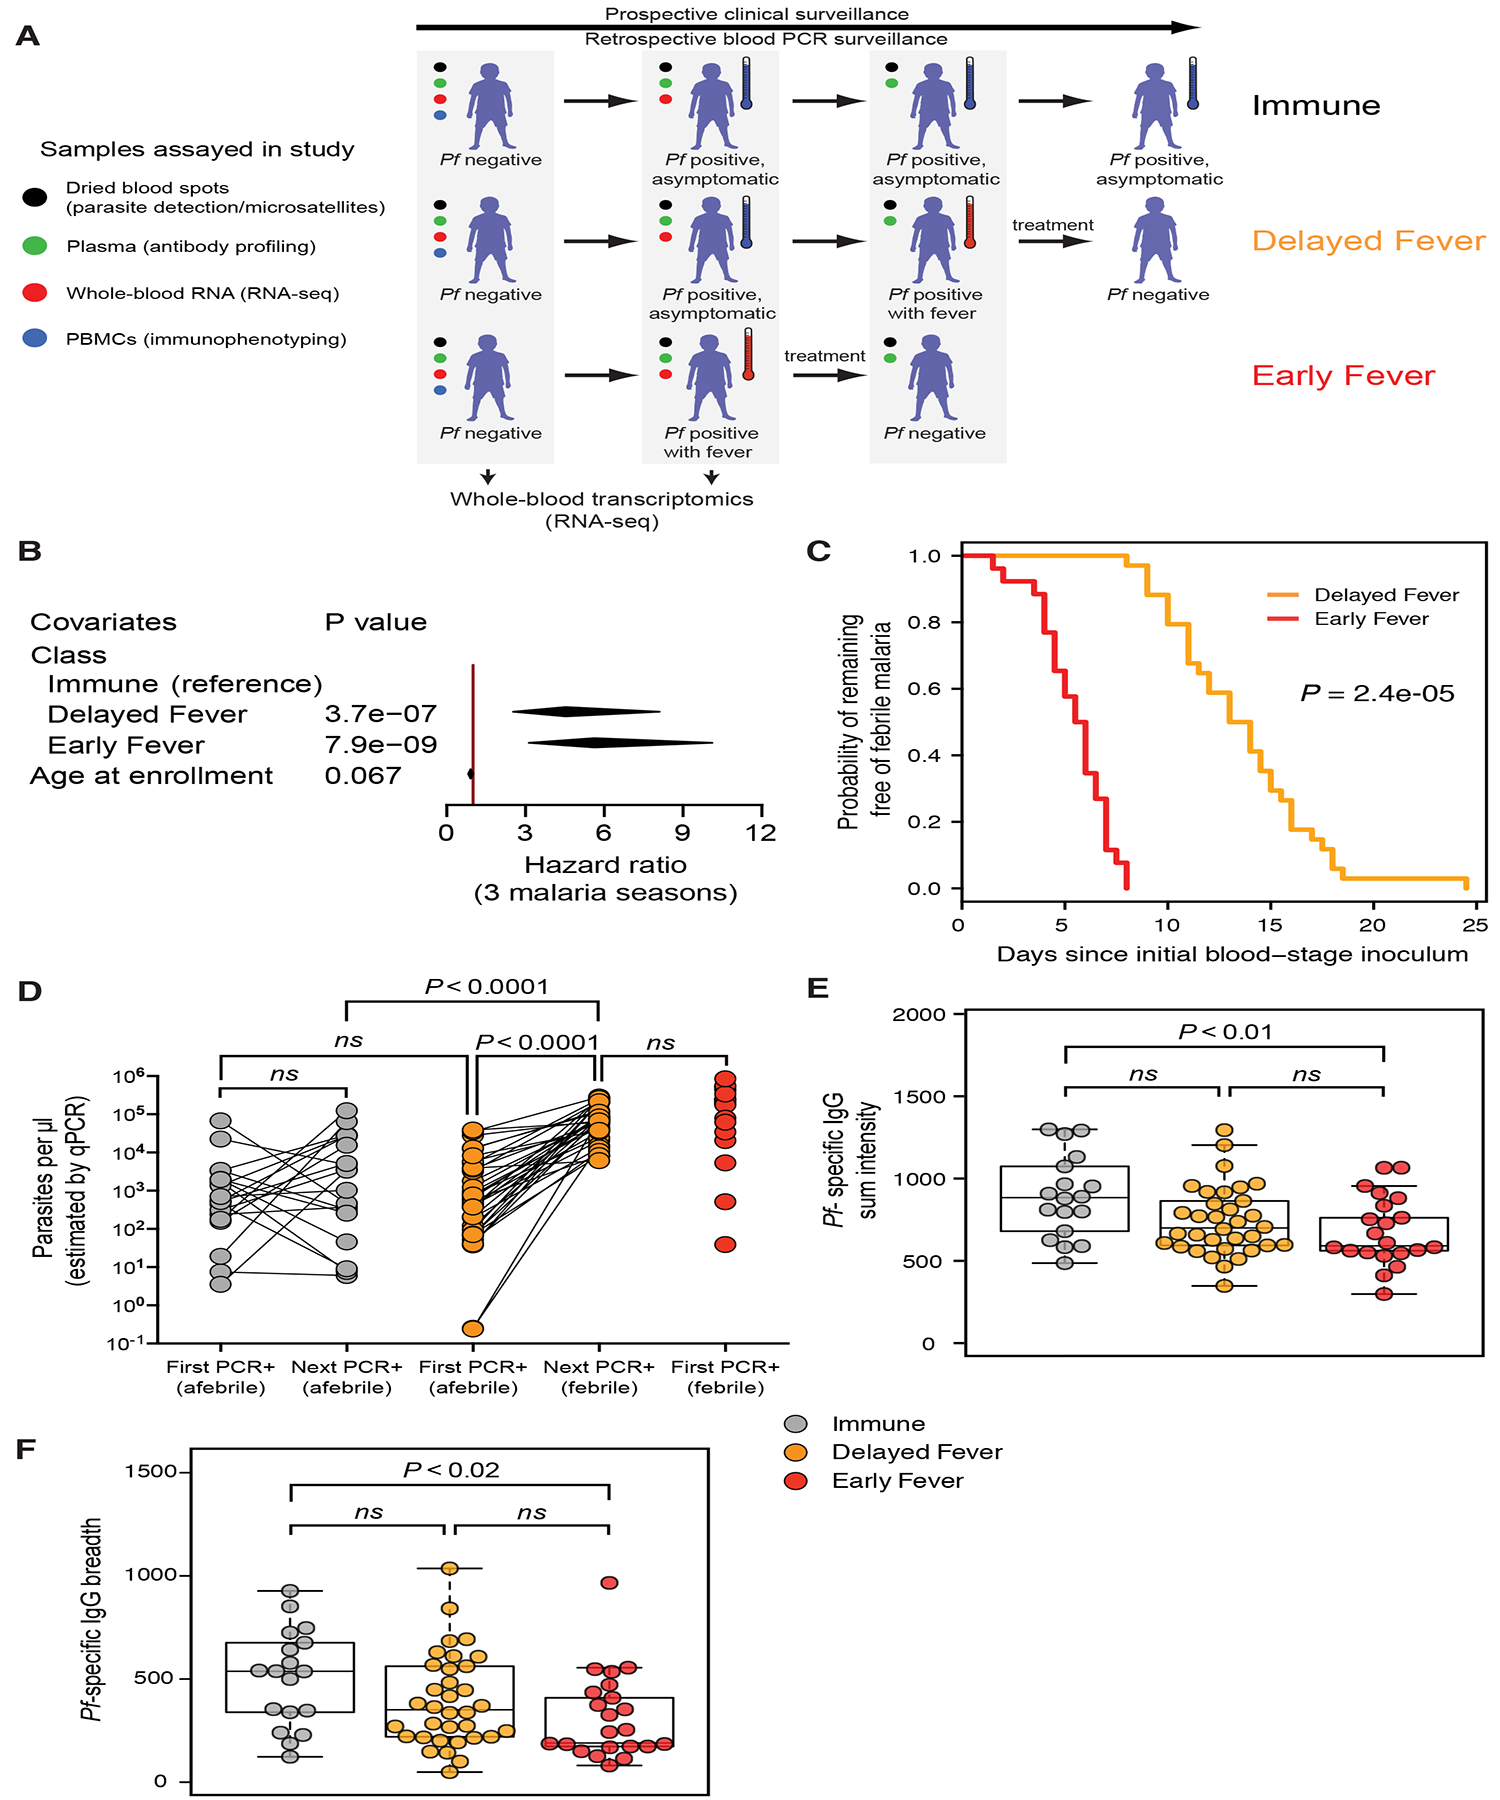
Figure 1. Prospective time-to-event data defined three clinically distinct classes of malaria susceptibility.

(A) Study design. Weekly clinical surveillance identified children with febrile malaria during one malaria season. Blood smears were performed at symptomatic visits, and anti-malarials administered if positive for parasitemia. Pf-specific PCR of dried blood spots collected at bi-weekly surveillance visits and at self-referred symptomatic visits were performed retrospectively to determine the first visit at which a child was infected with Pf irrespective of symptoms. Children classified as “Immune” (n=20) were infected but never developed malarial symptoms and thus never received anti-malarials. Asymptomatic children at the time of first infection who subsequently developed febrile malaria were classified as “Delayed Fever” (n=34). Children who were febrile at the time of first infection were classified as “Early Fever” (n=26). Please see also Figure S1 and Table S1. (B) Multiple malaria episodes over three consecutive malaria seasons were analyzed using the Andersen–Gill extension of the Cox regression model with class and age as co-variates. Diamonds represent 95% confidence intervals. (C) Kaplan-Meier curve showing probability of remaining free of febrile malaria since the first blood-stage inoculum (midpoint between last negative Pf PCR and first positive Pf PCR). P value determined by asymptotic log-rank test of left-censored data. (D) qPCR-estimated Pf densities at first infection and subsequent visit (within 2 weeks) in blood. Since the Early Fever class received anti-malarials at the first infection, qPCR was not performed for the subsequent visit. Significance was determined using a nested ANOVA with Tukey’s honest significant difference adjustment. (E, F) Pf-specific IgG responses prior to the first PCR-positive infection by class. Plasma was probed against a protein array containing 1087 Pf antigens. Shown are fluorescence intensities summed for reactive Pf antigens within a sample (E) or the number of Pf antigens reactive above background (F). Beeswarm plots are overlaid on boxplots indicating quartiles (boxes) and range (whiskers). Shown are Bonferroni-adjusted P values from Wilcoxon tests. Please see also Figure S2.
