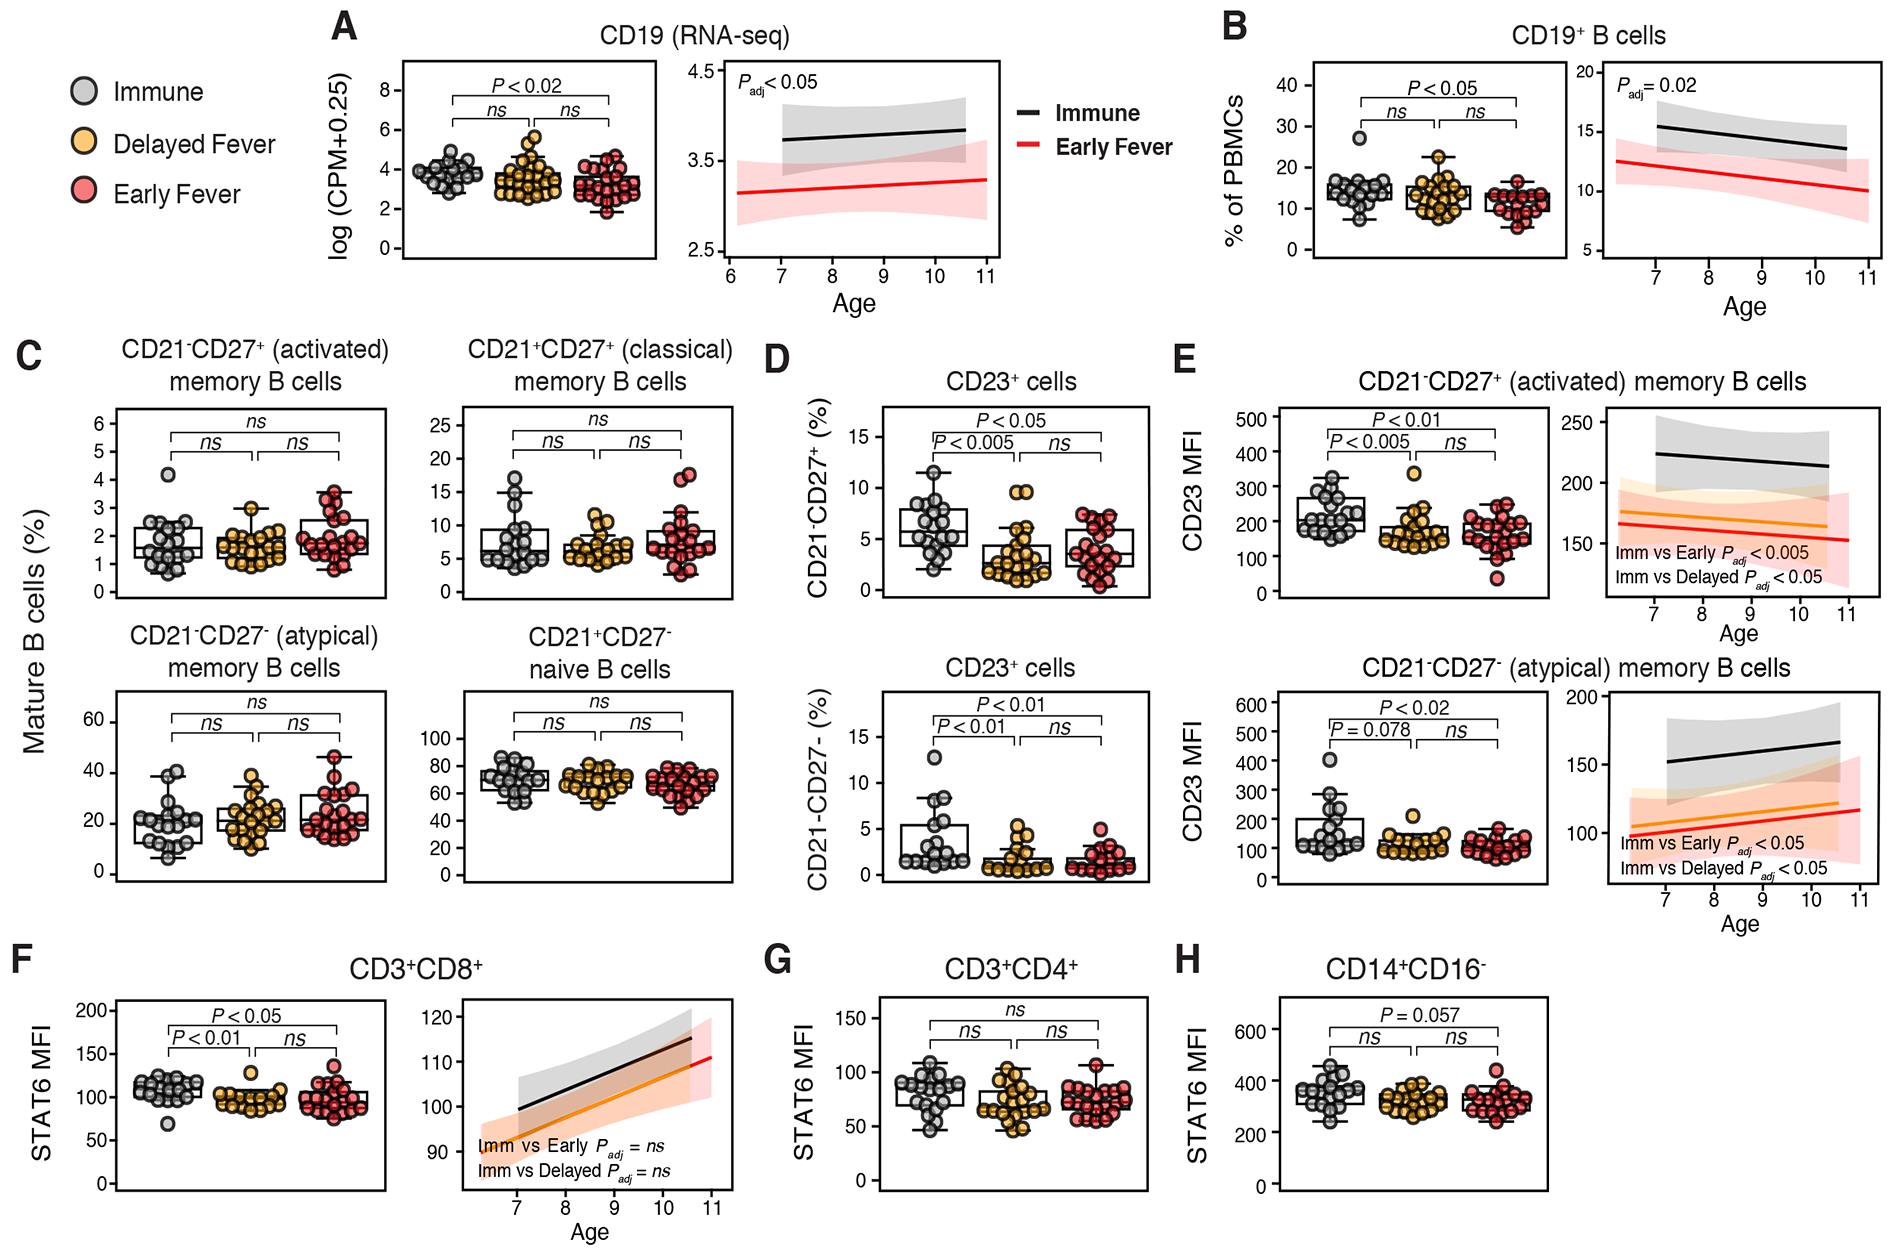
Figure 3. Flow cytometric analyses of PBMCs before infection reveals B cell enrichment and Th2 cell bias in Immune children.

Differences between (A) CD19 expression by whole-blood RNA-seq counts per million reads (CPM) and (B) CD19+ B cell percentages by class (left panel) and between Immune and Early Fever with adjustment for age (right panel). (C) % B cell subsets among CD19+CD10− mature B cells: activated MBCs (CD21−CD27+), classical memory B cells (MBCs) (CD21+CD27+), atypical MBCs (CD21−CD27−), and naïve B cells (CD21+CD27−). (D) % CD23+ (FcεRII) cells among activated and atypical MBCs. (E) Mean fluorescence intensity (MFI) of CD23 on activated and atypical MBCs and relationship between CD23 MFI and age. P values are for class comparisons of CD23 MFI with adjustments for age. STAT6 MFI in (F) CD8+ T cells (left panel), (G) CD4+ T cells, and (H) CD14+CD16− monocytes. For (F), the right panel shows the relationship between STAT6 and age for CD8+ T cells by class. For beeswarm plots, overlaid boxplots indicate quartiles (boxes) and range (whiskers); significance determined by Mann-Whitney test. For regression lines in panels A, B, E, and F, P values are for class comparisons of flow cytometry (response) variable with age as a covariate. Shown are 95% confidence bands. P values for all panels were Bonferroni adjusted. Please see also Figure S4.
