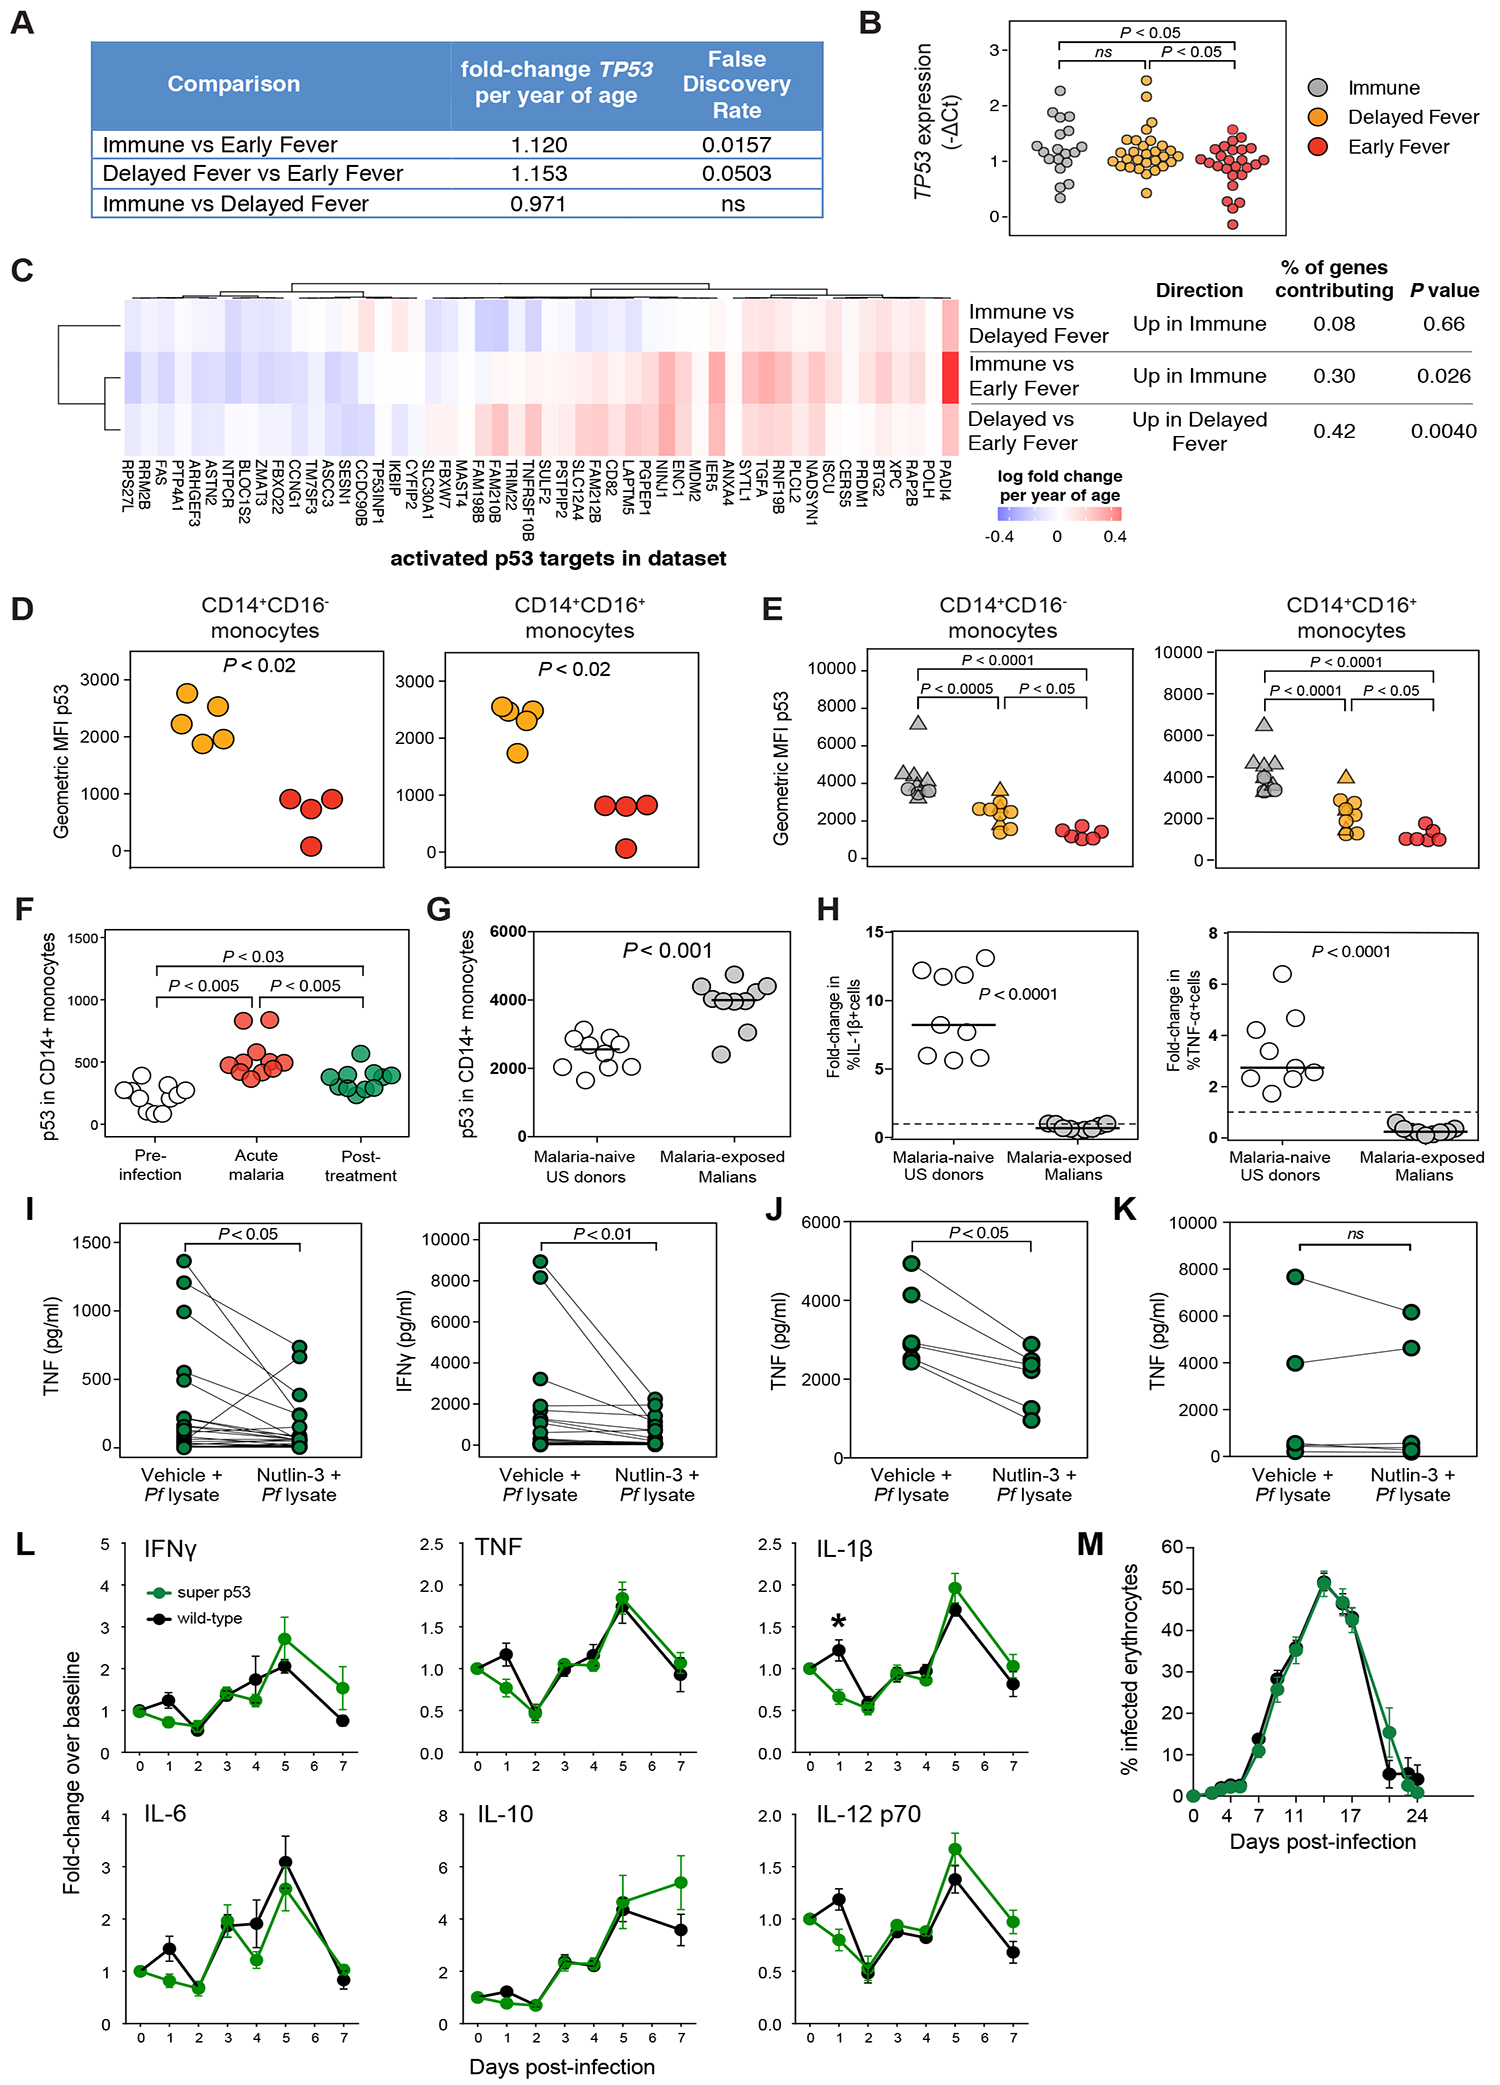
Figure 7. TP53 expression is associated with regulation of host inflammatory response but not control of parasite growth.

(A) Differential gene expression analysis for TP53 at the uninfected baseline. (B) TP53 expression in whole blood by qPCR before Pf infection. (C) Rotation self-contained gene set testing using a set of targets known to be activated by p53 for all comparisons at the uninfected baseline. Class differences in p53 expression determined by flow cytometry in peripheral CD14+ monocytes obtained at (D) the uninfected baseline (n=9) and (E) in May 2012 (n=26) using the anti-p53 monoclonal antibody clone PAb240. Triangles represent Pf-infected individuals. (F) Longitudinal p53 expression in CD14+ monocytes before, during acute malaria, and 7 days after treatment (n=11 subjects). (G) p53 expression in CD14+ monocytes in malaria-naïve US donors and malaria-exposed Malian donors using PAb240. (H) Change in % of IL-1β+ or TNF+ cells by intracellular staining after 12h stimulation of isolated CD14+ monocytes with Pf-infected red blood cell lysate (Pf lysate). Plasma concentrations of indicated cytokines in culture supernatants of (I) PBMCs (n=25 pairs); (J) CD14+ monocytes (n=6 pairs); and (K) CD14− non-monocytes (n=6 pairs) after 12 h stimulation with Pf lysate with and without the p53 stabilizer nutlin-3. (L) Changes in plasma concentrations of the indicated cytokines and (M) parasitemia in super p53 mice, which have an extra copy of Trp53, and wild-type littermates infected with Plasmodium yoelii 17XNL. Data are represented as mean ± standard error of the mean. Results are summarized data from five experiments that included 31 super-p53 mice and 33 wild-type mice. Significance differences between groups were determined by ANOVA with post-hoc Tukey’s HSD (B, E, F), Mann-Whitney (D, G, H), paired Wilcoxon tests (I, J, K), or t tests with Holm-Sidak-adjusted P values (L, M). ns = not significant, *P < 0.05.
