
Figure 4.
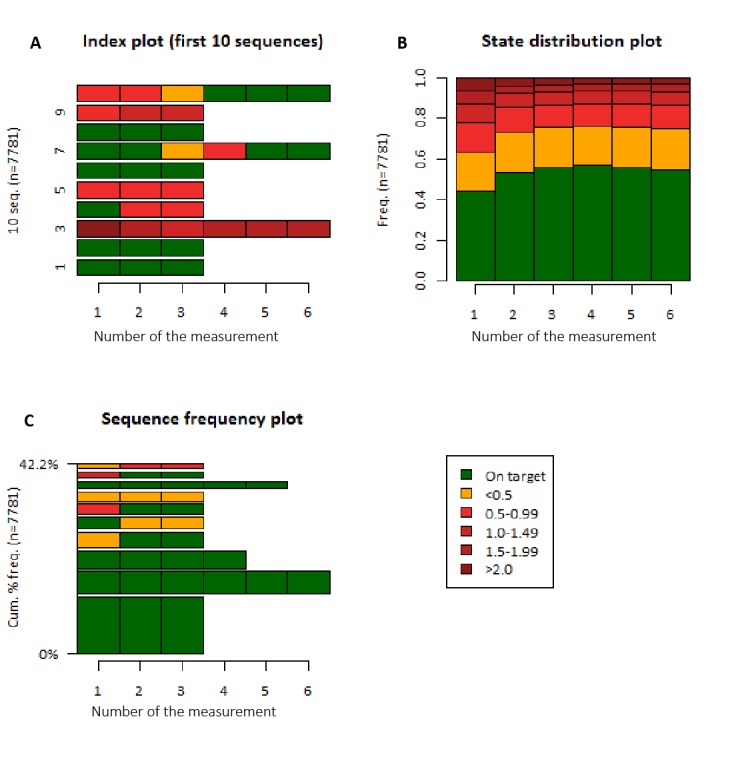
State sequences of low-density lipoprotein cholesterol (LDL-c) categories. A. Example of the sequences from the first 10 patients in the dataset (10 seq.). B. State distributions (equal to prevalence of LDL-c categories) per measurement. C. Most common sequences. LDL-c values in the legend are in mmol/L. Cum % freq: cumulative percentage frequency; Freq: frequency.