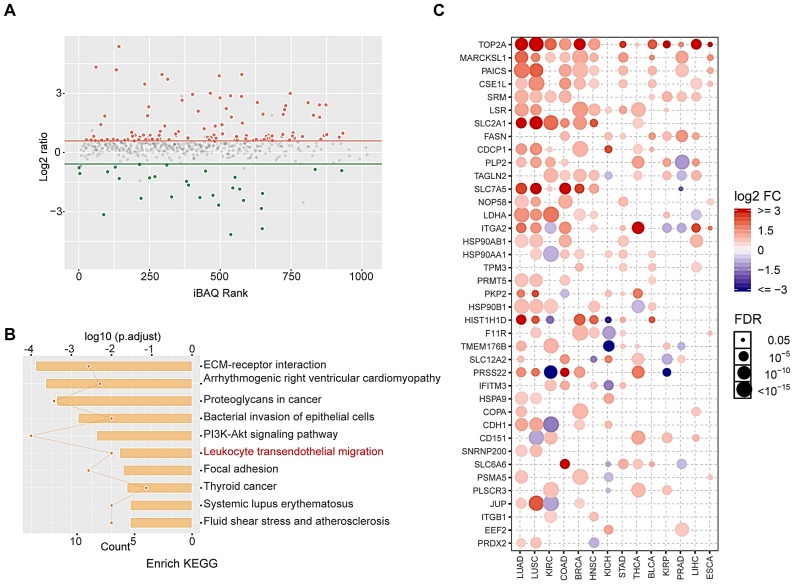
Figure 4.
Proteomic and bioinformatic analysis of altered cargos in radiation-induced sEVs. (A) Scatter plot showing the distribution of 146 differentially expressed proteins quantified in 8 Gy-sEVs and 0 Gy-sEVs (fold-change > 1.5 and P < 0.05). Red dots indicate up-regulated proteins and green dots indicate down-regulated proteins. (B) Kyoto Encyclopedia of Genes and Genomes (KEGG) pathway analysis of differentially expressed proteins. (C) Expression of up-regulated proteins in various cancers in the Cancer Genome Atlas (TCGA). The intensity of the color represents log2 fold-change (tumor vs normal). Y-axis shows protein name and X-axis shows tumor type, including lung adenocarcinoma (LUAD), lung squamous cell carcinoma (LUSC), kidney renal clear cell carcinoma (KIRC), colon adenocarcinoma (COAD), breast invasive carcinoma (BRCA), head and neck squamous cell carcinoma (HNSC), kidney chromophobe (KICH), stomach adenocarcinoma (STAD), thyroid carcinoma (THCA), bladder urothelial carcinoma (BLCA), kidney renal papillary cell carcinoma (KIRP), prostate adenocarcinoma (PRAD), liver hepatocellular carcinoma (LIHC), and esophageal carcinoma (ESCA).

