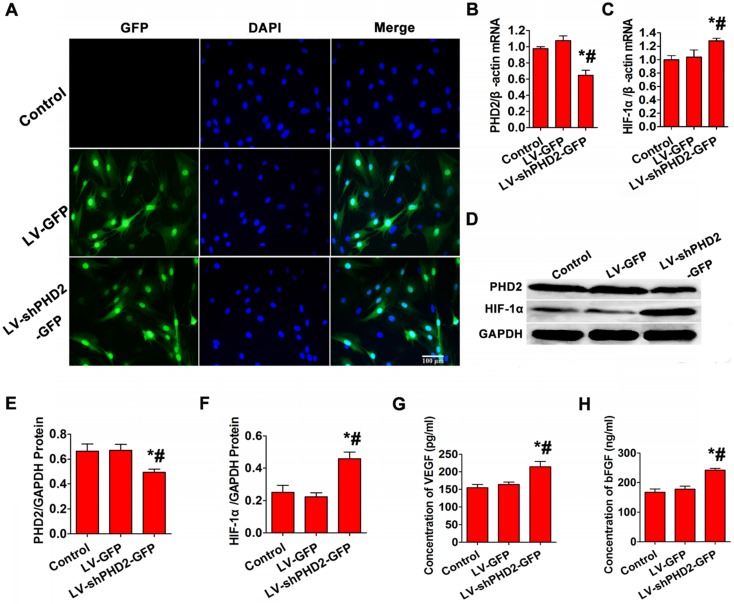
Figure 2.
PHD2, HIF-1α, and angiogenic gene expression analysis after in vitro PHD2 gene silencing. (A) Fluorescence microscopic examination of gene-transferred BMSCs. In the Control group, no GFP-positive cells were detected. More than 90% of GFP-expressing cells were found in the LV-GFP and LV-shPHD2-GFP groups. Bar, 100μm. (B-C) RT-PCR showed that PHD2 expression was decreased and HIF-1α expression was up-regulated after BMSCs were transfected with LV-shPHD2-GFP. (D-F) Western blotting analysis of PHD2 and HIF-1α expression levels showing down-regulation of PHD2 and up-regulation of HIF-1α after BMSCs were transfected with LV-shPHD2-GFP. (G) Concentrations of VEGF in the CMs from different groups. VEGF protein had a higher level in the LV-shPHD2-GFP group as compared to Control and LV-GFP groups. (H) Concentrations of bFGF in the CMs from different groups. The level of bFGF protein was higher in the LV-shPHD2-GFP group as compared to Control and LV-GFP groups. Values are mean ± SD. Significant differences were determined by using one-way ANOVA. N = 6/group. * P < 0.017 vs. control, # P < 0.017 vs. LV-GFP.

