Figure 5.
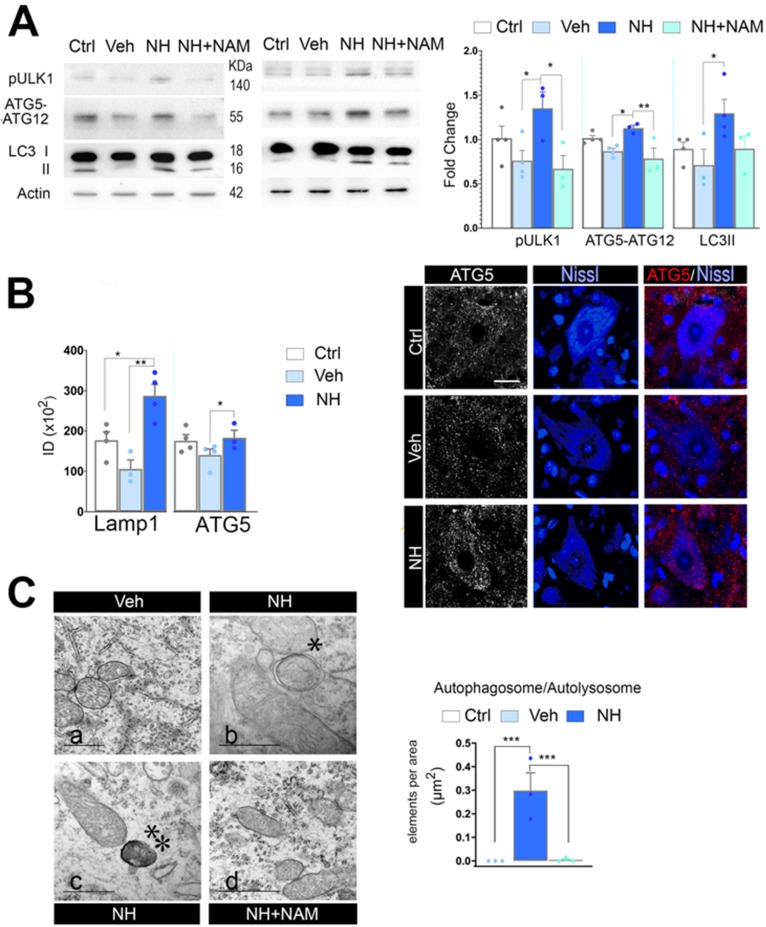
NeuroHeal activates SIRT1-dependent autophagy. (A) Western blots and bar graphs showing the analysis of pUlk1, ATG5-ATG12, and LC3II levels in different experimental groups at 3 dpi (n=4 per group, ANOVA, post hoc Bonferroni, *p<0.05, **p<0.01). (B) Left,Bar graphs of the mean immunofluorescence intensity for each marker within the MNs (n=4 animals per group, t-test, *p<0.05, **p<0.01). Right,Representative confocal microphotographs of samples ATG5 (red), and counterstained with FluoroNissl (Blue) from contralateral side (Ctrl) and injured side of vehicle-treated (Veh) and NH-treated animals. Scale bar 25 µm. (C) Left, Representative transmission electronic images within MNs form the different animal groups at 3 dpi. Note that only autophagosomes* or autolysosomes**, are detected in NH-treated MNs. Scale bar: a= 1 µM, b & c= 500 µM, d= 1000 µM. Right,Bar graph of the number of autophagosomes and autolysosomes found within MNs at each group per area (t-test, ***p<0.005).

