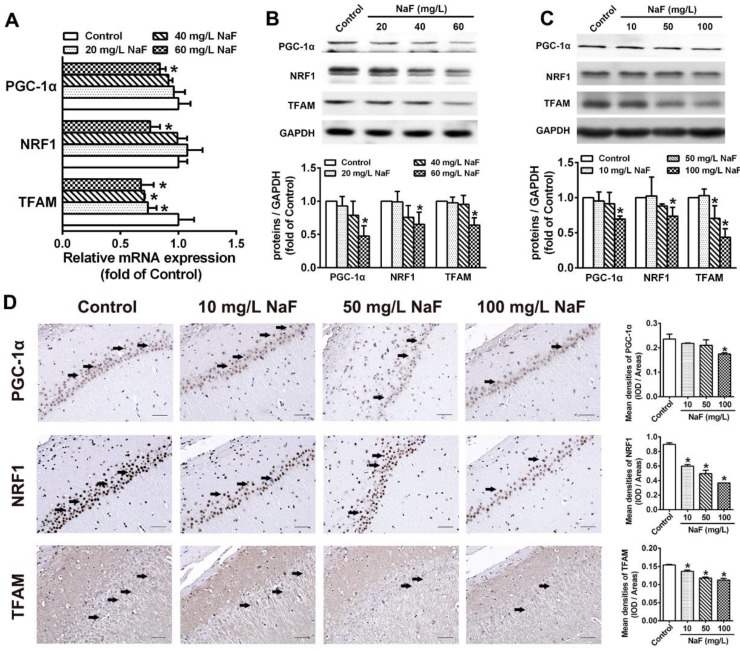
Figure 2.
NaF triggers disruption of mitochondrial biogenesis signaling molecules in vitro and in vivo. (A, B) RT-qPCR (A) and immunoblot (B) analyses of PGC-1α, NRF1 and TFAM in SH-SY5Y cells. Quantification represents the levels of the indicated mRNA and protein normalized to GAPDH. (C) Immunoblot analyses of PGC-1α, NRF1 and TFAM in hippocampal tissues (n = 3 rats per group). (D) Representative images of the IHC staining for PGC-1α-expressing (PGC-1α+), NRF1-expressing (NRF1+) and TFAM-expressing (TFAM+) neurons in hippocampal CA1 region. PGC-1α+, NRF1+ and TFAM+ neuronal cells are demonstrated by black arrows and quantified. Scale bars represent 50 µm, n = 2 rats per group. Data information: Data are presented as mean ± SD. Data were cumulative of at least three independent experiments (A-B). * P < 0.05 is considered significant compared with Control by one-way ANOVA test.

