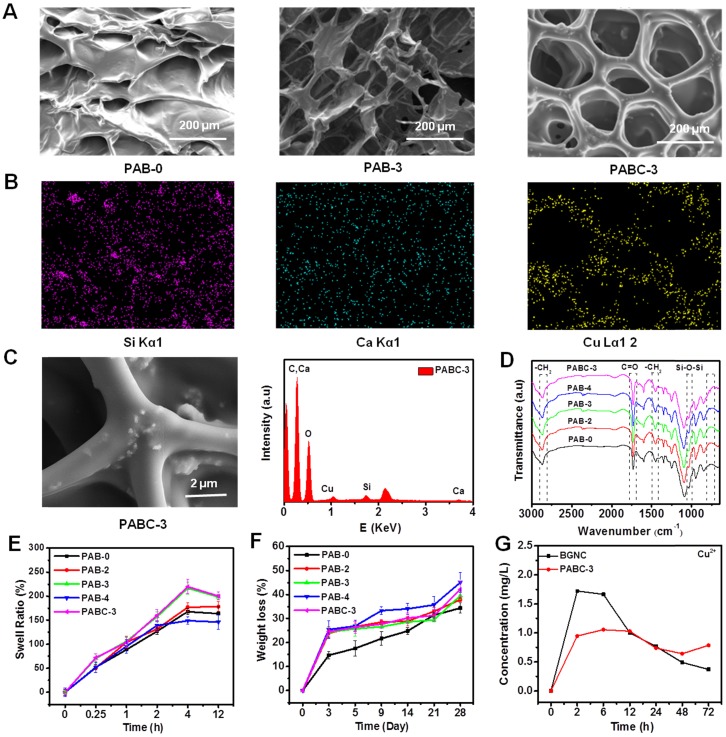
Figure 1.
Structure characterizations of PABC hydrogel. (A) SEM images showing the porous structure of hydrogel; (B) Mapping pictures of each element (Si, Ca and Cu); (C) High magnification SEM image of PABC3 hydrogel and EDS spectra; (D) FTIR spectra between 3000-650 cm-1; (E) Swell ratio and (F) Weight loss of PABC hydrogels; (G) Cu2+ release behavior in BGNC and PABC hydrogel. (*p<0.05 and **p<0.01.)

