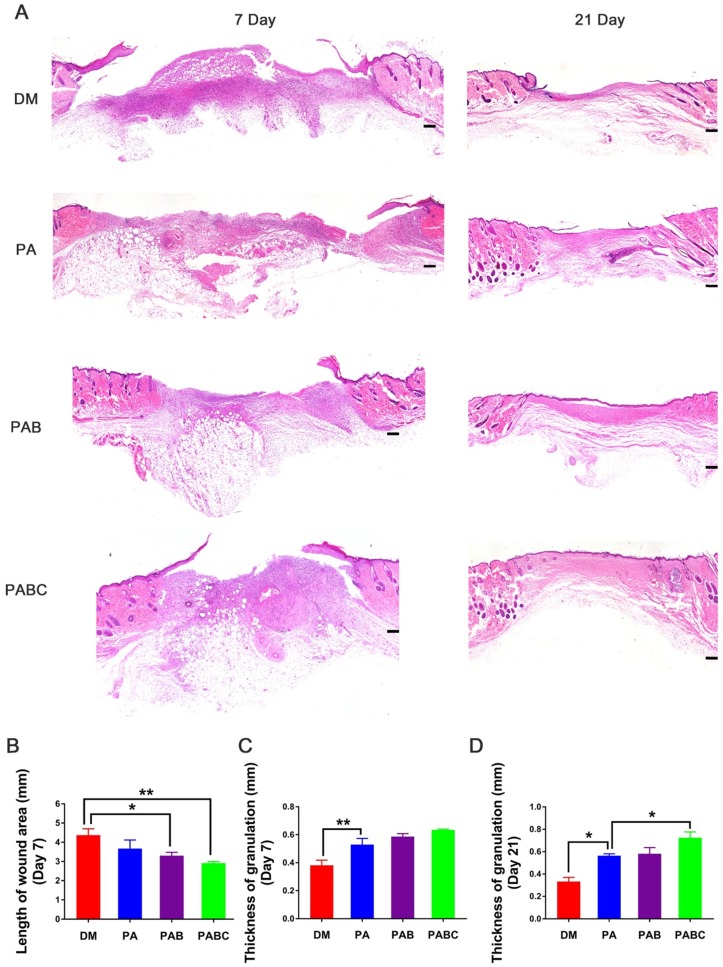
Figure 7.
Pathological evaluation of diabetic wound after treatment for 7 and 21 days. (A) Representative H&E staining images at day 7 and 21; (B) Wound length analysis at day 7; (C-D) Quantification evaluation of granulation tissue thickness at day 7 (C) and day 21 (D). Scale bar: 200 µm. (*p<0.05 and **p<0.01.)

