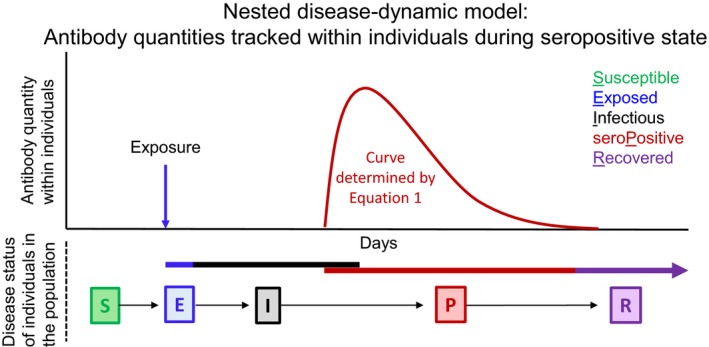
Figure 2.

Schematic of simulation model. Top plot shows that antibody quantities over time were tracked within individuals once they became infected (transitioned from S to E). Bottom shows that individuals transitioned between different epidemiological states. Note that seropositivity was possible when individuals were still in the I state, thus there was also an IP state which was not tracked explicitly.
