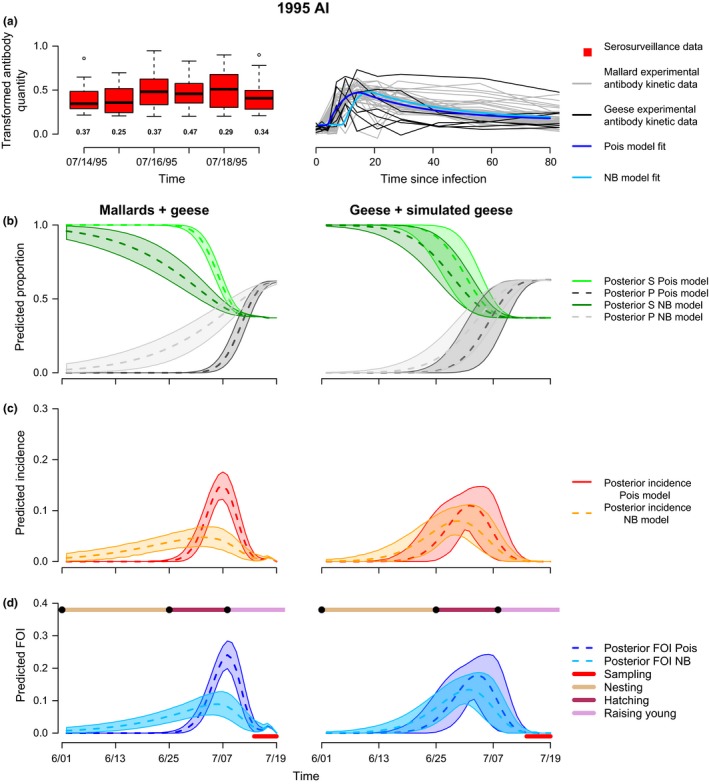
Figure 6.

Inference of FOI in snow geese. Transformed antibody quantities for serosurveillance data (y 2j) in snow geese are plotted for each sampling day (top, left). Boxes are the distribution of antibody quantities (median values indicated by line) for seropositive samples while the numbers below the boxes indicated the proportion of samples that were seronegative. Transformed antibody quantities for the 30 experimental mallards (grey lines) and six snow geese (black lines) are plotted over time (top, right) along with the Poisson and negative binomial model fits for the combined mallard/geese data estimated using within‐host function, g. We used two different experimental datasets for model fitting: observed antibody kinetics of 30 mallards and six snow geese (left column plots) and observed antibody kinetics for six snow geese plus 30 simulated antibody kinetic curves generated using parameters of the observed snow geese data fit to eqn (1) (right column plots). Row 2: Model predicted proportions of susceptible (green) and seropositive (black) individuals over time in days. Row 3: Predicted incidence over time. Row 4: Predicted FOI over time. The red bar along the bottom indicates the sampling period. The bar along the top indicates reproductive events in the snow goose life cycle. Two different models were used for fitting: Box 1 model specification (indicated as Pois), and Box 1 model specification with TSI distributed as a negative binomial random variable instead of Poisson (indicated as NB). Shaded areas indicate 95% credible intervals.
