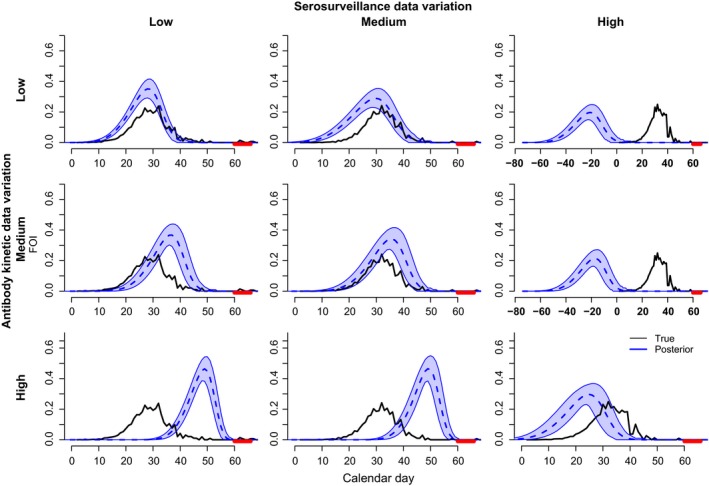
Figure 7.

Model performance as a function of individual‐level variation. Levels of individual variation for antibody kinetic (black) and seropositive serosurveillance data (red). Plots are as in Fig. 3d. Three levels of individual variation were examined: low, medium and high. Rows indicate effects of variation in serosurveillance data while holding variation in antibody kinetic data constant. Columns indicate effects of variation in antibody kinetic data while holding variation in serosurveillance data constant. Parameter values are given in Supporting Information 6‐Table 3.
