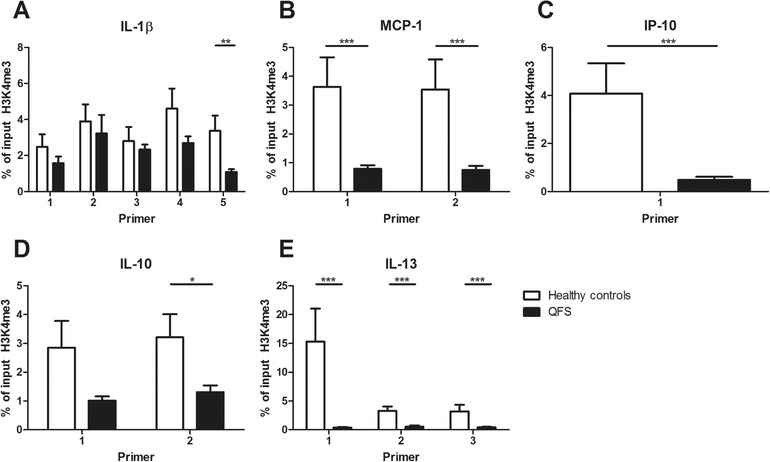
Figure 4.

Expression of H3K4me3 in monocytes of QFS patients compared to healthy controls, Expression of H3K4me3 in monocytes of QFS patients was compared to healthy controls, using various primers. (A) Decreased expression of H3K4me3 on the IL‐1β promoter region, using primer 5 (p = 0.004). (B) Decreased expression of H3K4me3 on MCP‐1 promoter region, using primer 1 and 2 (p < 0.001 and p < 0.001, respectively). (C) Decreased expression of H3K4me3 on the IP‐10 promoter region, using primer 1 (p < 0.001). (D) Decreased expression of H3K4me3 on the IL‐10 promoter region, using primer 2 (p = 0.041), not primer 1 (p = 0.078). (E) Decreased expression of H3K4me3 on the IL‐13 promoter region, using primer 1, 2, and 3 (p < 0.001, p < 0.001, and p = 0.001, respectively). H3K4me3 expression was measured with qPCR. Primers used in the reaction are listed in Table S1. Samples were analyzed following a comparative Ct method, myoglobin was used as a negative control and H2B as a positive control for H3K4me3. Data were analyzed with the Mann–Whitney test and are depicted as mean ± SEM. Data are derived from one single experiment that consisted of 15 patients and 16 healthy controls. Abbreviations: H3K4me3, histone 3 lysine 4 trimethylation; MCP, monocyte chemoattractant protein; IP, interferon gamma‐induced protein; QFS, Q fever fatigue syndrome; qPCR, quantitative real‐time PCR. *p ≤ 0.05; **p ≤ 0.01; ***p ≤ 0.001
