
Figure 3.
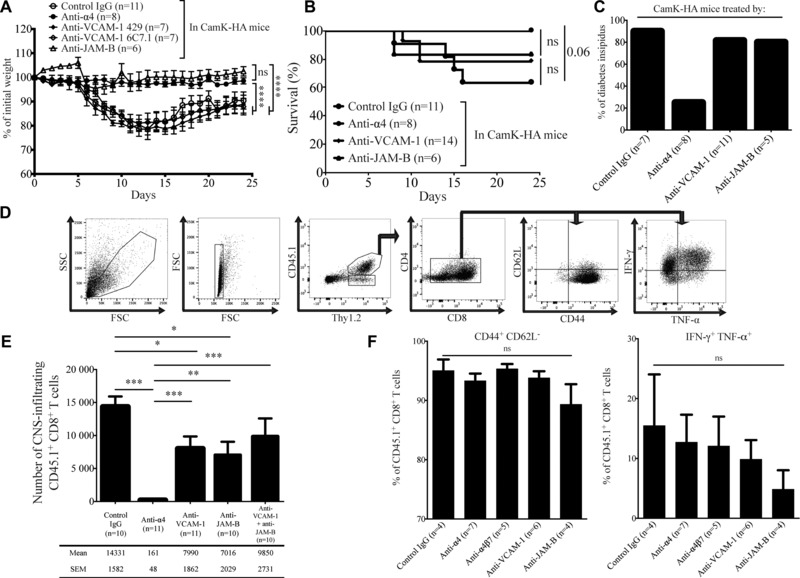
VCAM‐1 blockade retains the clinical phenotype and only partly decreases CD8 T cell CNS infiltration. (A–C) Adoptive transfer of 5 × 10⁶ cytotoxic HA‐specific CD8 T cells in CamK‐HA mice treated at day 0, 4, and 8 by an anti‐α4‐integrin, a control IgG, anti‐VCAM‐1 (clone 429 or 6C7.1), or an anti‐JAM‐B mAb. Impact on the weight (A), survival (B), and on development of diabetes insipidus (C). Pool of two independent experiments, each involving three to six mice per group. (A) One‐way ANOVA ***p < 0.0001. (B) Log‐rank (Mantel–Cox) test, ns. Data represent mean ± SEM. (D–F) FACS analysis of CNS‐infiltrating cells at day 8 after adoptive transfer of 5 × 10⁶ CD45.1+ cytotoxic HA‐specific CD8 T cells in CD45.2+ CamK‐HA mice treated at day 0 and 4 by a control IgG, an anti‐α4‐integrin, an anti‐VCAM‐1 (clone 6C7.1), an anti‐JAM‐B, or both an anti‐VCAM‐1 and anti‐JAM‐B mAbs. (D) Illustration of the general gating strategy. (E) Absolute number of CD45.1+ CD8+ T cells infiltrating the CNS. Pool of two to three independent experiments using three to five mice per group. Mann–Whitney test, *p < 0.05, **p < 0.001, ***p < 0.0001. Data represent mean ± SEM. (F) Percentage of CD45.1+ CD8+ T cells that are CD44+ CD62L− and that produce IFN‐γ and TNF‐α. Pool of two independent experiments using two to three mice per group. One‐way ANOVA, ns. Data represent mean ± SEM.