
Figure 1.
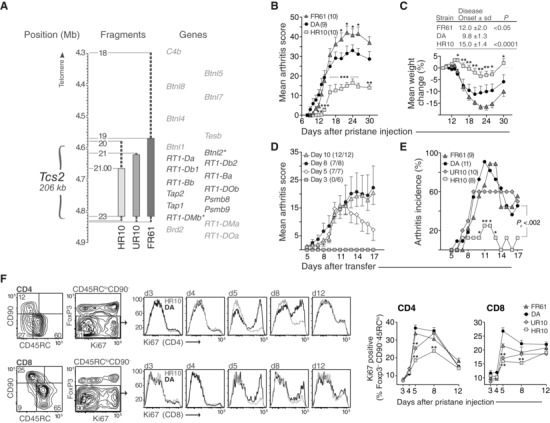
Tcs2 controls pathogenicity and expansion of T cells after pristane administration. (A) Physical map of the rat MHC‐II region. Asterisked genes are located within the flanking borders of T cell selection QTL 2 (Tcs2) while shaded genes are excluded. Congenic strains are depicted as vertical bars with dashed lines representing intervals of unknown genotype. Numbers next to fragments represent genetic markers and have been described previously 12. (B‐C) Clinical arthritis scores (B) and weight change (C) in DA and Tcs2‐congenic strains after pristane administration (max score = 60). Inset table shows day of disease onset (± standard deviation, S.D.) and p‐value versus DA. (D) Individual transfer T cells were adoptively transferred (one donor to one recipient) on day 3, 5, 8, or 10 after administration of pristane. Numbers in brackets depict recipients with arthritis out of total. (E) Individual transfer between Tcs2‐congenic strains. T cells were transferred on day 5 after pristane administration. Pc = p value for cumulative incidence. (F) Expression of Ki67 in CD4+ (upper row) and CD8+ (lower row) activated/memory T cells (CD90‐ CD45RClo Foxp3‐) in pristane dLNs at indicated time‐points after disease induction. Counter plots show gating strategy and adjacent histograms representative examples of Ki67 expression in DA (black) and DA.1HR10 (shaded); n = 5 per group. A–F: *p<0.05, **p<0.01 (by Mann–Whitney). (B–E) Data shown are representative of at least three independent experiments. (F) Data shown are pooled from five independent experiments. Error bars in B, C (graph), D, E, and F (graphs) represent standard error of the mean (SEM).