Figure 5.

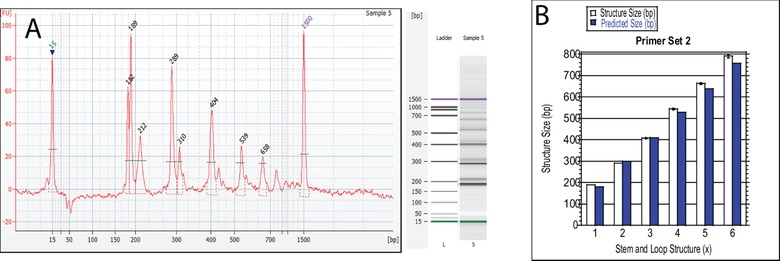
(A) Electropherogram of final LAMP Assay with Primer Set 2. (B) Graphical comparison between the predicted and experimentally determined structure size and for every stem and loop structure size.

(A) Electropherogram of final LAMP Assay with Primer Set 2. (B) Graphical comparison between the predicted and experimentally determined structure size and for every stem and loop structure size.