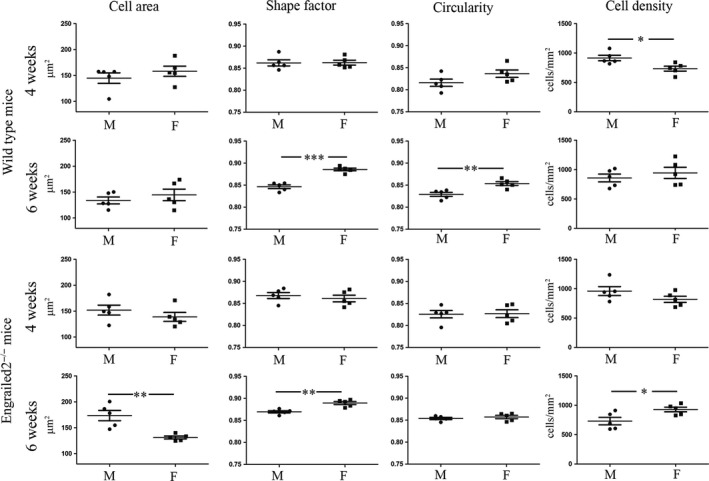
Figure 5.

Histograms showing differences between male and female mice, of wild type (WT) and En2 −/− genotype, at 4 weeks and 6 weeks of age, on cell area, shape factor, circularity and cell density. Asterisks indicate statistical significance: *P < 0.05; **P < 0.01; ***P < 0.001.
