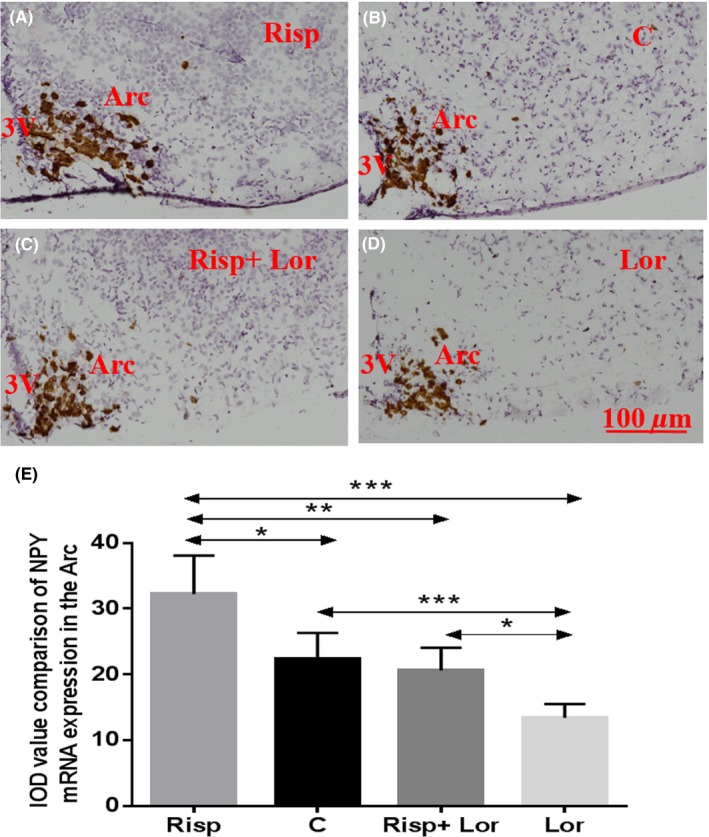
Figure 5.

Upregulated NPY mRNA expression in the Arc caused by risperidone treatment and downregulated NPY mRNA expression in the Arc after treated by lorcaserin; (A) NPY mRNA expression in the Arc of risperidone‐treated mouse; (B) NPY mRNA expression in the Arc of control mouse; (C) NPY mRNA expression in the Arc of risperidone + lorcaserin‐treated mouse; (D) NPY mRNA expression in the Arc of lorcaserin‐treated mouse; (E) data are means ± SEM of 6 mice per group. *P < .05, **P < .01, ***P < .001, control group vs risperidone‐treated group. 3V: the third ventricle; Arc: arcuate hypothalamic nucleus; Risp: risperidone‐treated group; Lor: lorcaserin‐treated group; Risp + Lor: risperidone + lorcaserin‐treated group; C: control group; Scale bar = 100 µm
