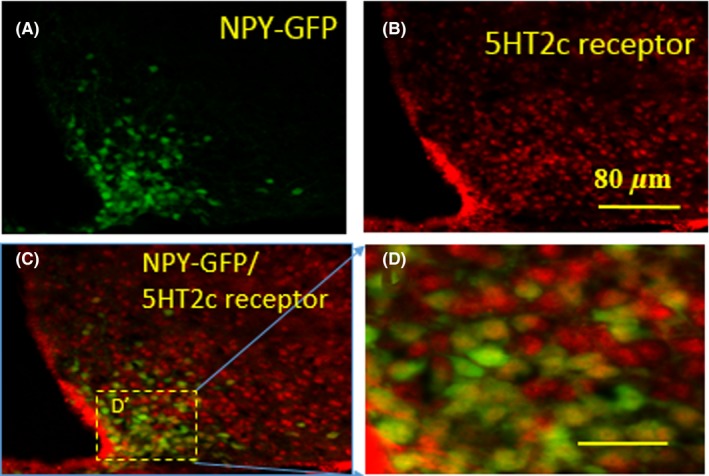
Figure 6.

Fluorescent immunohistochemical detection of 5HT2c receptor and NPY neurons coexpressed in the Arc. A, Green staining shows NPY neurons expressing GFP; (B): red staining shows the 5HT2c receptors; (C): yellow staining indicating that the neurons express both 5HT2c receptors and NPY; (D) is higher magnification of the boxed area in D’. Scale bars in A, B, and C is 80 μm and in D is 25 μm
