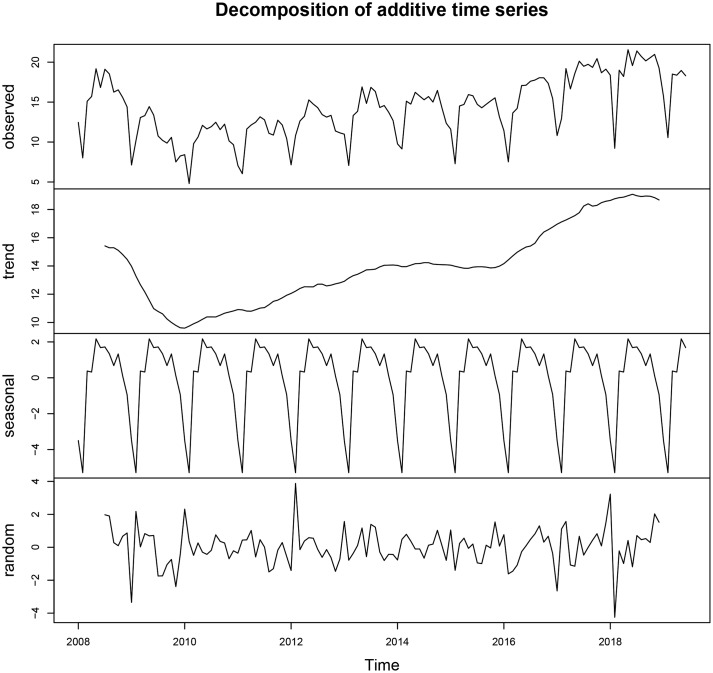
Fig. 1.
Monthly CT incidence (1/100 000) from January 2008 to June 2019 in Shenzhen and long-term trend, seasonal fluctuation and random fluctuation. (a) The actual CT incidence from January 2008 to June 2019; (b) the decomposed trend trait of CT incidence; (c) the decomposed seasonal trait of CT incidence and (d) the decomposed random fluctuation trait of CT incidence.

