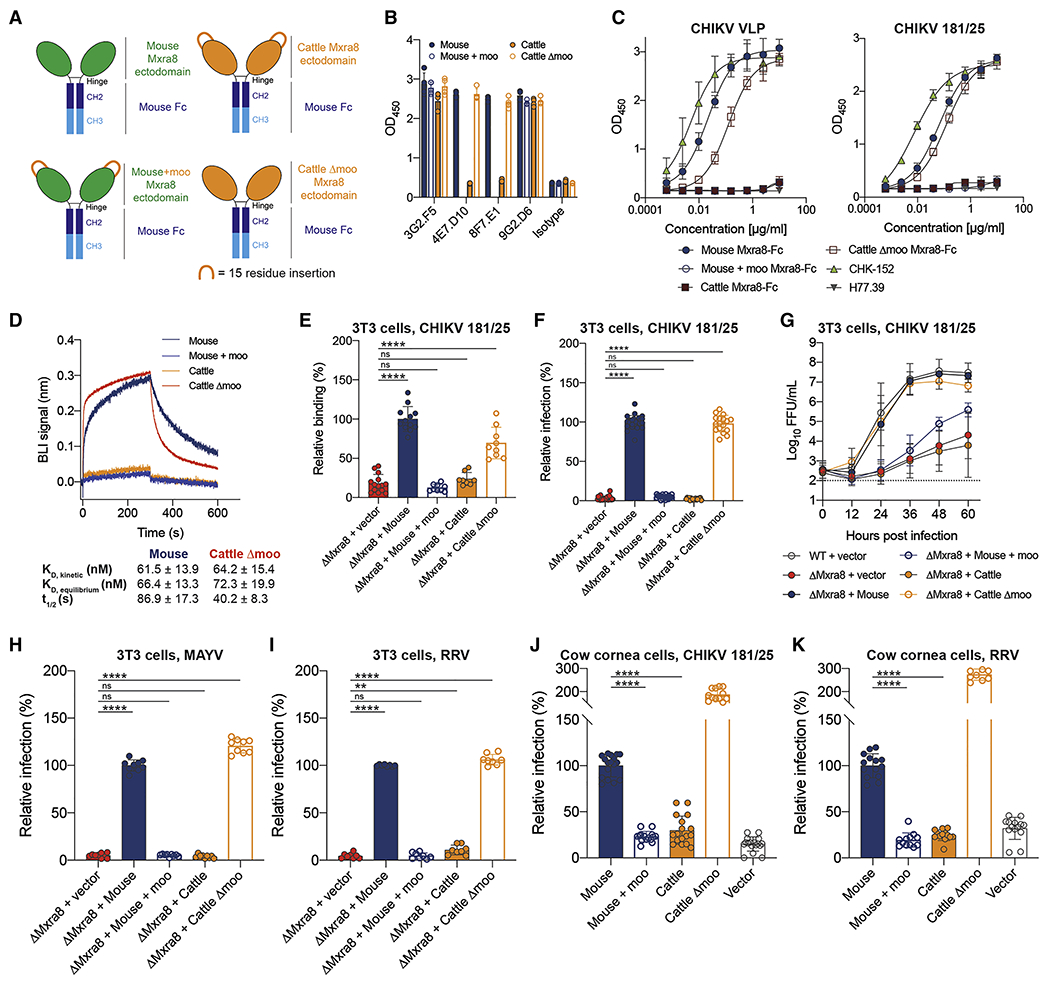
Figure 3. Effect of the 15-amino acid insertion in cattle Mxra8 on alphavirus binding and infection.

A. Diagram of mouse, cattle, mouse + moo [GEQRVGEQRLGEQRV insert], and cattle Δmoo Mxra8-Fc fusion proteins. B. Binding of anti-Mxra8 mAbs 3G2.F5, 4E7.D10, 8F7.E1, and 9G2.D6 to mouse, cattle, mouse + moo, and cattle Δmoo Mxra8-Fc fusion proteins by ELISA. Data are pooled from four experiments performed in duplicate. C. Binding of increasing concentrations of mouse, cattle, mouse + moo, and cattle Δmoo Mxra8-Fc fusion proteins to antibody-captured CHIKV VLPs and CHIKV 181/25 virions by ELISA. Data are pooled from two to three experiments performed in duplicate. D. Representative kinetic sensograms of bacterially-expressed mouse (blue), mouse + moo (light blue), cattle (orange), and cattle Δmoo (red) Mxra8 binding to CHIKV VLPs as determined by BLI. CHIKV VLPs were captured using an anti-CHIKV mAb (CHK-265) and then incubated with Mxra8 proteins. Binding data represent the average of three experiments. E. Binding of CHIKV 181/25 virions to 3T3 ΔMxra8 cells complemented with mouse, mouse + moo, cattle, or cattle Δmoo Mxra8 cDNA. Virions were incubated with cells at 4°C, and CHIKV antigen staining was analyzed by flow cytometry. Data are pooled from three to four experiments (n = 9 to 14 replicates; one-way ANOVA with Dunnett’s post-test: ****, P < 0.0001). F-I. Lentivirus complementation of 3T3 ΔMxra8 cells with Mxra8 cDNA from mouse, mouse + moo, cattle, and cattle Amoo. Cells were inoculated with (F, G) CHIKV (181/25), (H) MAYV (BeH407), or (I) RRV (T48). For G, a multi-step growth analysis was conducted, and virus was titrated by focus-forming unit assay. Data are pooled from three experiments performed in sextuplicate. For F, H-I, cells were processed at specified time points (see STAR Methods) and stained with virus-specific anti-E2 protein mAbs. J-K. Lentivirus complementation of bovine cornea cells with Mxra8 cDNA of mouse, cattle, mouse + moo, and cattle Amoo. Cells were inoculated with (J) CHIKV (181/25) or (K) RRV (T48) and processed by staining with anti-E2 protein mAbs. The relative increase in CHIKV and RRV infection in bovine cornea cells expressing cattle Δmoo Mxra8 may reflect the higher levels of surface expression (see Fig S5C). For F, H-K, data are pooled from three to nine experiments (n = 6 to 26 replicates; one-way ANOVA with Dunnett’s post-test: **, P < 0.01; ****, p < 0.0001). See Fig S3 and S4.
