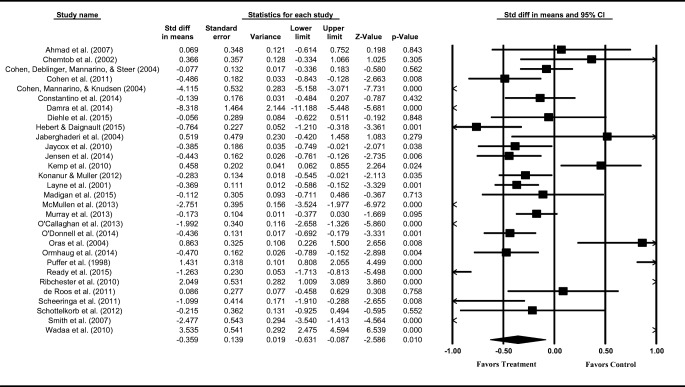
Fig. 1.
Treatment with children and adolescents for PTSS reduction – overall summary effect size results. Note. The graph displays effect size estimates of each study as boxes and their 95% confidence intervals as whiskers. The effect size estimate of the combined result or summary effect size is displayed as a rhombus

