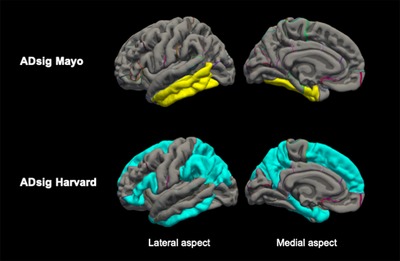
FIGURE 1.

AD cortical signature composites used in the analysis. ADsig Mayo (top row), surface area–weighted mean of entorhinal cortex, fusiform, inferior, and middle temporal regions; ADsig Harvard (bottom row), surface area–weighted mean of entorhinal cortex, parahippocampus, inferior parietal lobe, pars opercularis, pars orbitalis, pars triangularis, inferior temporal, temporal pole, precuneus, supramarginal gyrus, superior parietal, and superior frontal regions; AD, Alzheimer's disease
