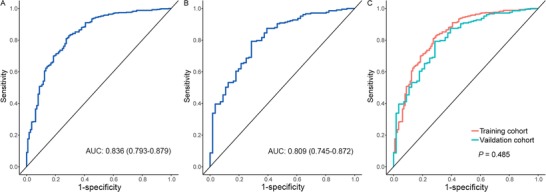
Figure 3.

The ROC curve of the logistic regression model. A‐B shows the ROC curves of the multivariate logistic regression model with radiomics score and age in the training (A) and validation (B) cohorts. C shows the test between the two ROC curves using the DeLong method
