
Figure 1.
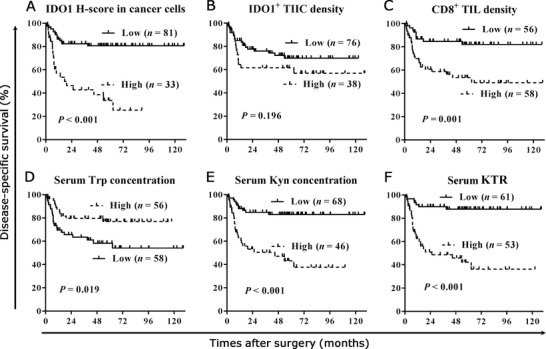
Kaplan‐Meier DSS curves stratified by different variables in 114 patients with PSCC. DSS curves stratified by IDO1 H‐score in cancer cells (A), IDO1+ TIIC density (B), CD8+ TIL density (C), serum Trp concentration (D), Kyn concentration (E) and KTR (F). DSS was different among subgroups stratified by all variables (all P < 0.05) except IDO1+ TIIC density (P = 0.196). Abbreviations: DSS, disease‐special survival; IDO1, Indoleamine 2,3‐dioxygenase 1; PSCC, penile squamous cell carcinoma; Kyn, kynurenine; Trp, tryptophan; TIIC, tumor‐infiltrating immune cell; KTR, Kyn/Trp ratio