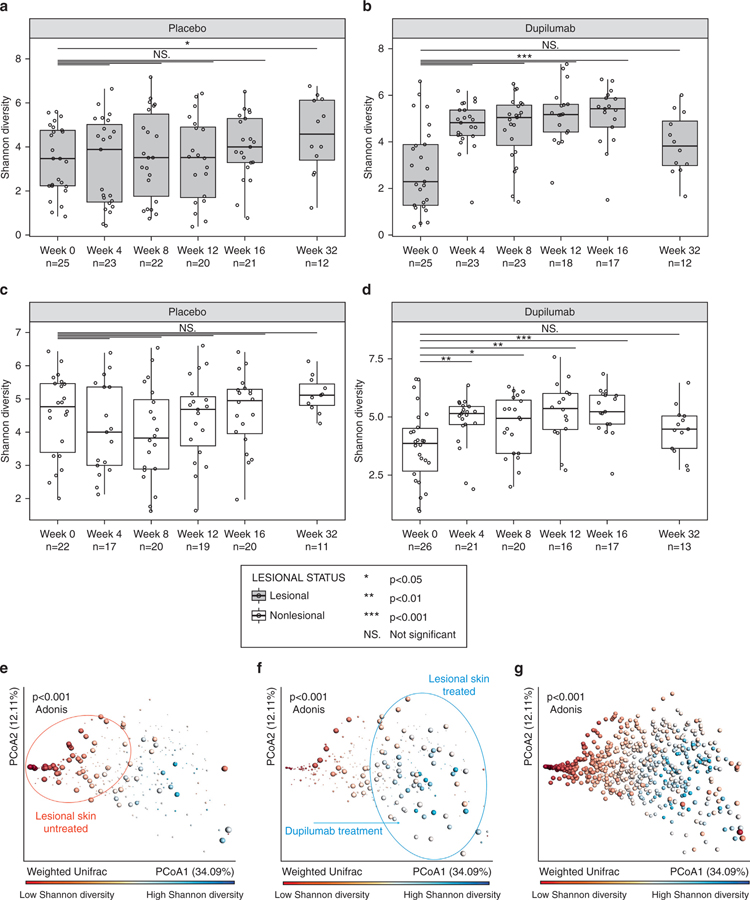
Figure 3. Shannon microbial α-diversity and β-diversity.
(a–d) α-diversity: (a) Lesional skin, placebo group; (b) Lesional skin, dupilumab-treated group; (c) Nonlesional skin, placebo group; (d) Nonlesional skin, dupilumab-treated group. (e–g) β-diversity: PCoA plots showing Shannon diversity of skin samples; red indicates low diversity and blue indicates high diversity. (e) Large dots depict lesional skin samples from the dupilumab-treated group in periods without treatment (weeks −2, 0, and 32) and small dots represent other samples (nonlesional skin during periods of treatment), showing that without dupilumab treatment, samples are mainly located on the left side with a low Shannon diversity (red circle). (f) Large dots depict lesional skin samples from the dupilumab-treated group taken during the treatment period (weeks 4, 8, 12, and 16); small dots represent other samples (nonlesional skin, no treatment) showing that with dupilumab treatment, samples shift to the right with higher Shannon diversity (blue circle). (g) All samples (placebo and dupilumab, lesional and nonlesional skin) at all time points, indicating a clear separation between lesional skin (left, low Shannon diversity [red]) and nonlesional skin (right, high Shannon diversity [blue]) and significant separation between low and high Shannon diversity (P < 0.001, Adonis test). Each dot represents an individual sample; the color of the dot reflects the bacterial Shannon diversity index on a continuous scale (red indicates low diversity and blue indicates high diversity). *P < 0.05, **P < 0.01, ***P < 0.001; Mann–Whitney U test, with Bonferroni correction for multiple comparison. PCoA, Principal coordinates analysis.

