Figure 1.

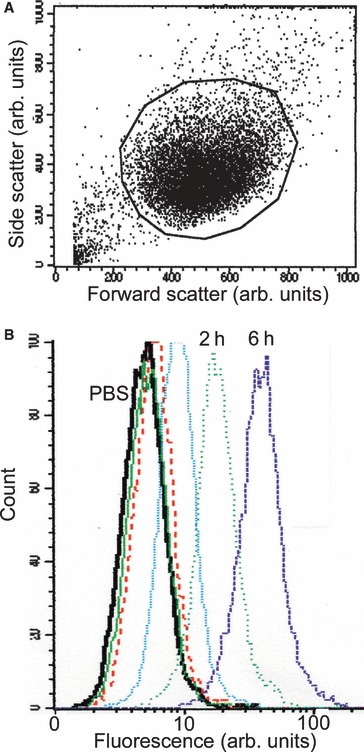
Flow cytometry to measure internalized fluorophore‐conjugated cystatin C. (A) Scattergram from a FACS Calibur flow cytometer. Subconfluent A‐431 cells were incubated for 6 h in medium containing NaCl/Pi (control). Cells were then trypsinized and analysed. At least 3000 events were measured. This experiment shows the typical distribution of cells in all internalization experiments in which this methodology was used. The y‐axis depicts side scattering and the x‐axis depicts forward scattering. (B) Distribution of cells in relation to cell fluorescence. Subconfluent A‐431 cells were incubated in medium containing fluorescence‐labelled cystatin C and analysed after being trypsinized. The y‐axis depicts cell count and the x‐axis depicts the amount of cell fluorescence (488 nm). The curves represent the result of the analysis of each cell population incubated with NaCl/Pi (black line), cystatin C for 10 s (green line), 5 min (red dotted line), 30 min (light blue dotted line), 2 h (green dotted line) and 6 h (dark blue dotted line), respectively.
