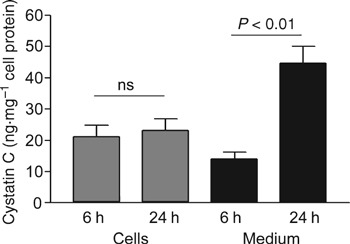
Figure 4.

Cellular and secreted cystatin C in Capan‐1 cells. The presence of secreted endogenous cystatin C in the medium as well as the content of endogenous cystatin C in the cell extract was quantified by ELISA. The cystatin C level of the cell lysate and medium were correlated to the protein concentration of the corresponding cell lysate. Results are expressed as mean ± SD (all groups n = 6). Statistical analysis was carried out using Mann–Whitney U‐test.
