
Figure 3.
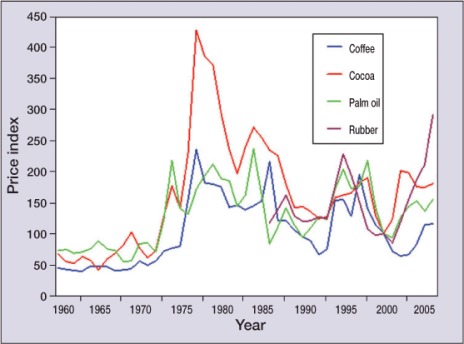
Global annual price indices for coffee, cocoa, palm oil, and rubber, 1960–2006. Data show the relative price for each commodity against an index of 100, set at different years for each commodity. Data from the UNCTAD statistical database (http://www.unctad.org).