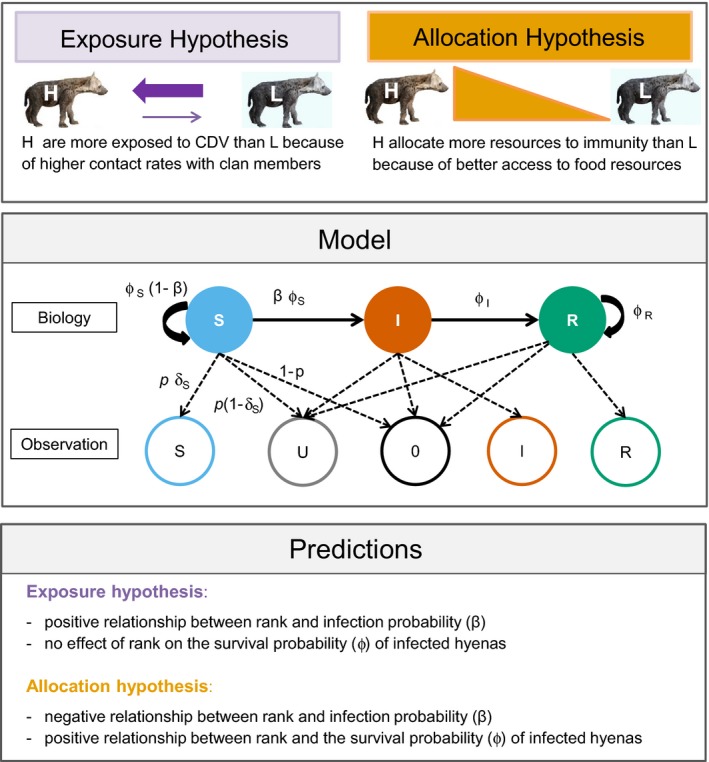
Figure 1.

Schematic representation of hypotheses, predictions and study design. Top: The two hypotheses (“H”: high‐ranking, “L”: low‐ranking). Centre: Processes underlying model construction, with infection process at the top and observation process at the bottom: Infection states (solid circles, S [blue]: “susceptible”, I [orange]: “infected”, R [green]: “recovered”) and transitions between states (solid black arrows) as a function of the probability of surviving in a given state (ϕi, with i specific for S, I and R) and the probability of staying susceptible (1 − β) or becoming infected (β). Infection states are linked (dashed black arrows) to four events (left to right): detected individual is assigned S (empty blue circle), detected individual is assigned U (empty grey circle), individual not detected (0, empty black circle), detected individual assigned I (empty red circle) and detected individual assigned R (empty green circle). With p the detection probability, δj the probability of assigning an infection state (j being specific for S, I and R), p δj the probability of assigning a detected individual to an infection state, p (1 − δj ) the probability of detecting an individual and assigning it U and 1 − p j the probability of not detecting an individual—only shown for S for simplicity. Bottom: The predictions of both hypotheses in terms of probability of infection (β) and survival (ϕ)
