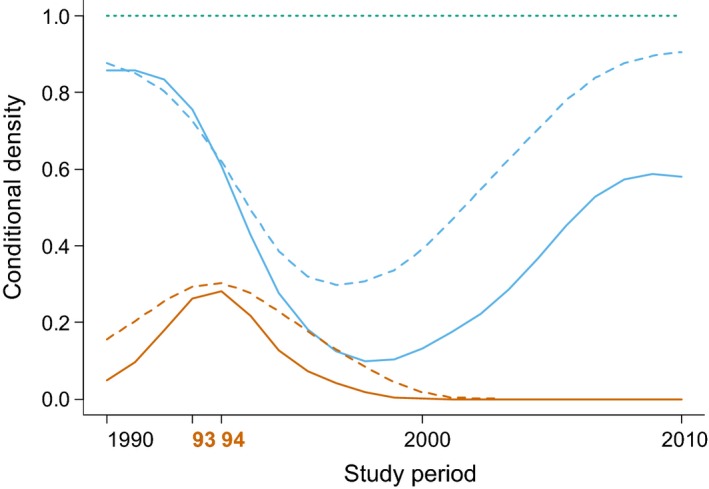
Figure 2.

Conditional probability distribution of the three infection states “susceptible”, “infected” and “recovered” during the study period 1990–2010. These probability densities are obtained with the cdplot function in R which computes a smoothing kernel density function. Solid lines: females, dashed lines: males. The probability densities of “infected” are represented by the area below the orange lines, those of “susceptible” cover the area between the orange and the blue lines and those of “recovered” cover the area between the blue lines and 1, the green dotted horizontal line. The virulent canine distemper virus (CDV) epidemic (1993–1994) is indicated in orange on the x‐axis. An interpolation factor was used to smooth the lines between data points
